Have you ever wanted to use Google Fonts in the Power BI text box, highlight text with different colors, or give an option to end-user to change the font size to make the text box more professional with easy-to-understand content?
This article explained how to add these functions to your text box with HTML Content
visual and HTML codes. To add the HTML Content visual to your Power BI report, click on the following link and follow the instructions: https://www.html-content.com/installation
The HTML Content Visual has two fields, Value and Granularity. The value field accepts either a column or measure that contains valid HTML. (for more details, check this link: https://www.html-content.com/reference/data-roles)
Useful HTML codes for creating a text box in Power BI:
HTML Paragraphs:
The HTML <p> element defines a paragraph.
A paragraph always starts on a new line, and the visual automatically add some white space (a margin) before and after a paragraph.
HTML Headings:
HTML headings are titles or subtitles that you want to display and define with the <h1> to <h6> tags. Each HTML heading has a default size. However, you can specify the size for any heading with the style attribute using the CSS font-size property.
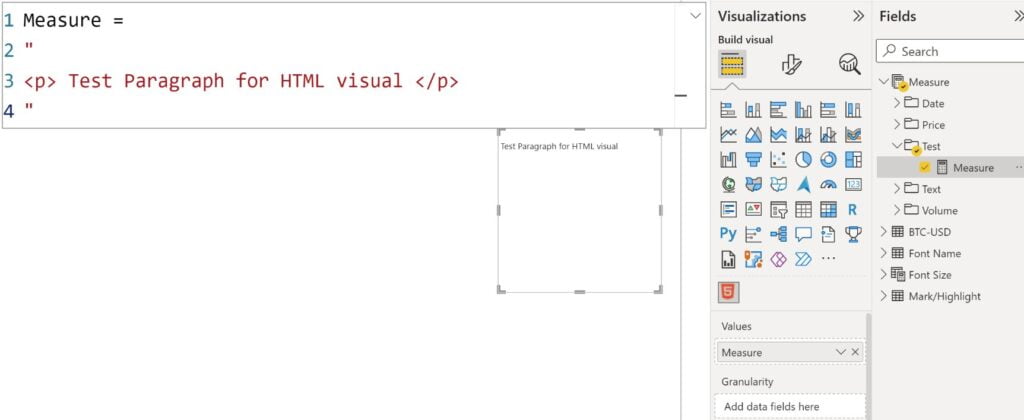
A measure needs to be created with HTML codes between the Quotation marks; then you can add the measure to the HTML visual; for instance, create a measure as below:
Measure = ” <p> Test Paragraph for HTML visual </p> “
If you add this measure to the value field of the HTML visual in the Power BI, it will show the paragraph like this:
HTML Styles:
To add styles to the HTML text or items such as colour, font, size, and more, you need to use HTML style.
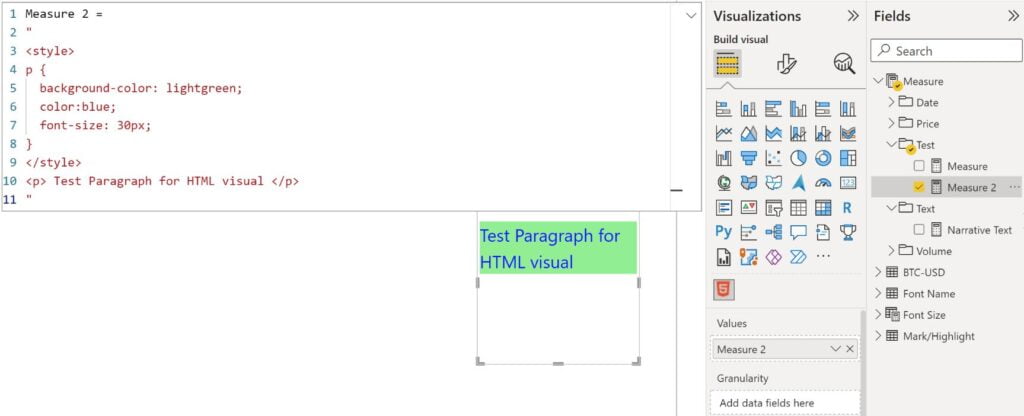
For instance, to add styles to the paragraph to change the text colour to blue and set the font size to 30, you need to add HTML style to your code and create a measure like this:
Measure 2 =
“
<style>
p {
color:blue;
font-size: 30px;
}
</style>
<p> Test Paragraph for HTML visual </p>
“
Output:

“background-color” is an option in HTML style to add a background color to the text to highlight that, for instance, to highlight the previous text in green, you can use this measure:
Measure 2 =
“
<style>
p {
background-color: lightgreen;
color:blue;
font-size: 30px;
}
</style>
<p> Test Paragraph for HTML visual </p>
“
Google Fonts In HTML:
To use Google Fonts in the Power BI HTML visual, all you have to do is add a special styles item to your HTML code; first, add a stylesheet link to request the desired web font(s):
<link rel=”stylesheet”
href=”https://fonts.googleapis.com/css?family=Font Name”>
Then, style an element with the requested web font, either in a stylesheet:
p {
font-family: ‘Font Name’, serif;
}
To update the previous measure with the Google Fonts, open the Google Fonts web and select one font name: https://fonts.google.com/
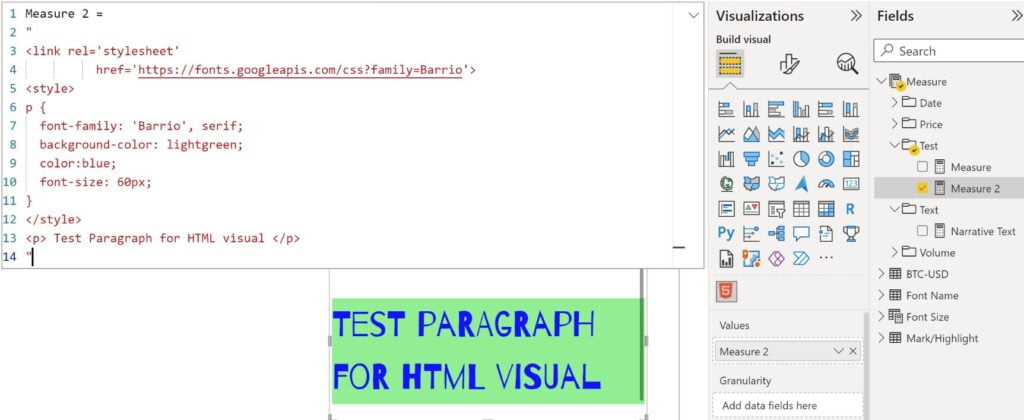
Then use the selected fone name in the HTML code; I chose the Barrio so that the new measure will be as follows:
Measure 2 =
“
<link rel=’stylesheet’
href=’https://fonts.googleapis.com/css?family=Barrio’>
<style>
p {
font-family: ‘Barrio’, serif;
background-color: lightgreen;
color:blue;
font-size: 60px;
}
</style>
<p> Test Paragraph for HTML visual </p>
“
To mark a word or some part of the text, you can use <mark> in your HTML code in the Power BI:
Measure 2 =
“
<link rel=’stylesheet’
href=’https://fonts.googleapis.com/css?family=Barrio’>
<style>
p {
font-family: ‘Barrio’, serif;
background-color: lightgreen;
color:blue;
font-size: 60px;
}
</style>
<p> Test <mark> Paragraph </mark> for HTML visual </p>
“
Output:

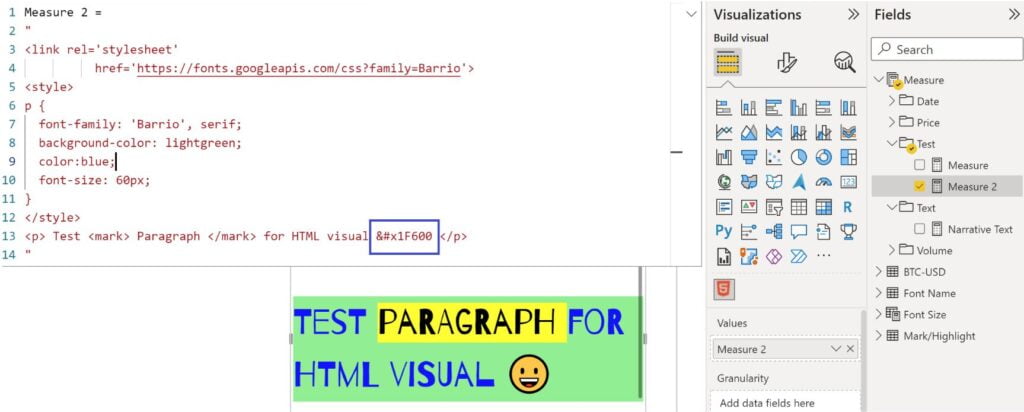
If you want to add any emojis to your text, you need to use decimal (dec) or hexadecimal (hex) references; click on the below link to find those codes:
https://www.w3schools.com/charsets/tryit.asp?deci=128512
For instance:
Note 1: You can use Variable to make your Measure and HTML code dynamic
Note 2: You can create a list of your favourite Google fonts, then use that in the slicer with the DAX code in the HTML code to switch between fonts (Like the sample file of this article)
Note 3: To change the font size, add a parameter to your report, and use the SELECTEDVALUE of that parameter in the HTML code to drive that with slicer.
Download The Sample File:


