
Sports
Analytics
No Data Found
No Data Found
No Data Found
What we do
Here, coaches realise that success is a moving target and to stay relevant they must be committed to life-long learning, honest evaluation and continuous improvement and they plan meticulously and with great attention to detail.

iPad app and Cloud Platform
You can get access to resources and trainings across the Internet from remote servers.

Analysis Training Courses
Courses here provides insights into how you can perform analysis on sports data .

First Pass - Analysis Services
This ensures the best of the services and best of advisors and keep tabs on the work.
What is analytics?
It is a long established fact that a reader will be distracted by the of readable content of a page when looking at its layout.
- Advance Advisory Team
- Professional Consulting Services
- 24/7 Support Help Center
- Customer Service & Operations

Streamline your workflow
-

Capture
It is a long established fact that a reader will be distracted by the readable content of a page when looking at its layout.
-

Content
It is a long established fact that a reader will be distracted by the readable content of a page when looking at its layout.
-

Analysis
It is a long established fact that a reader will be distracted by the readable content of a page when looking at its layout.
-
Data
It is a long established fact that a reader will be distracted by the readable content of a page when looking at its layout.


Analysts, Athletes & Students

Design
Predictive Modeling

Photography
Memory Statistics

Photography
Simulation

Photography
Optimization

Design
Forecasting

HTML
Text Analytics

HTML
Statistical Analysis

Video
Data Mining

Photography
Fraud Detection

HTML
Predicting Fitness
Photography
Memory Statistics
Photography
Simulation
Photography
Optimization
Photography
Fraud Detection
Video
Data Mining
FC use video and stats to improve performance
Faff about only a quid blower I don’t want no agro bleeding chimney pot burke tosser cras nice one boot fanny.!
Recent Blog

From Emotional Resonance to User Accessibility: Mastering Color in Dashboards Understanding the Art of Color in Design Design is more than just aesthetics; it’s about communication. And one of the most potent tools in a dashboard designer’s arsenal is colour. Through colours, we can evoke specific emotions, draw attention, and even guide user interactions. Have […]

Visualization to help with project management Navigating the intricate landscape of project management in the dynamic business realm requires a comprehensive tool that not only captures the intricate interplay of tasks and timelines but also provides a visual roadmap for successful execution. In this case, even an advanced bullet chart won’t do the job because […]

Transforming Data Interpretation: Enhancing Engagement, Insight, and Accessibility in Power BI Dashboards IntroductionThe digital age has magnified the importance of data, but the real power lies in how we interpret and act on that data. A dashboard’s primary role isn’t merely about displaying numbers — it’s about crafting an immersive and intuitive experience that translates […]

Enhancing User Experience Through Thoughtful UI and Tailored Typography. Power BI, by default, offers a select palette of font options. While these fonts are legible and professional, sometimes, there’s a need to step outside the default range to align with branding guidelines or add a distinctive aesthetic touch to your reports. But as with all […]
From Understanding Audiences to Mastering UI/UX: A Journey Through Engaging Report Design. Crafting a Power BI report isn’t merely about showcasing numbers or charts. It’s an art where data is woven into a narrative that’s not just informative but also intuitive, accessible, and immensely valuable to its intended audience. When you’re tasked with creating such […]

Automated Theme Tagging: Visualising Insights from Survey Comments using ChatGPT and Python. Here, we’ll explore how you can seamlessly tag each survey comment with its corresponding key topic. This serves as an invaluable tool for crafting intuitive visualisations and dashboards. Starting Point: We have 107 survey comments saved in a CSV file. Step 1: Obtain […]
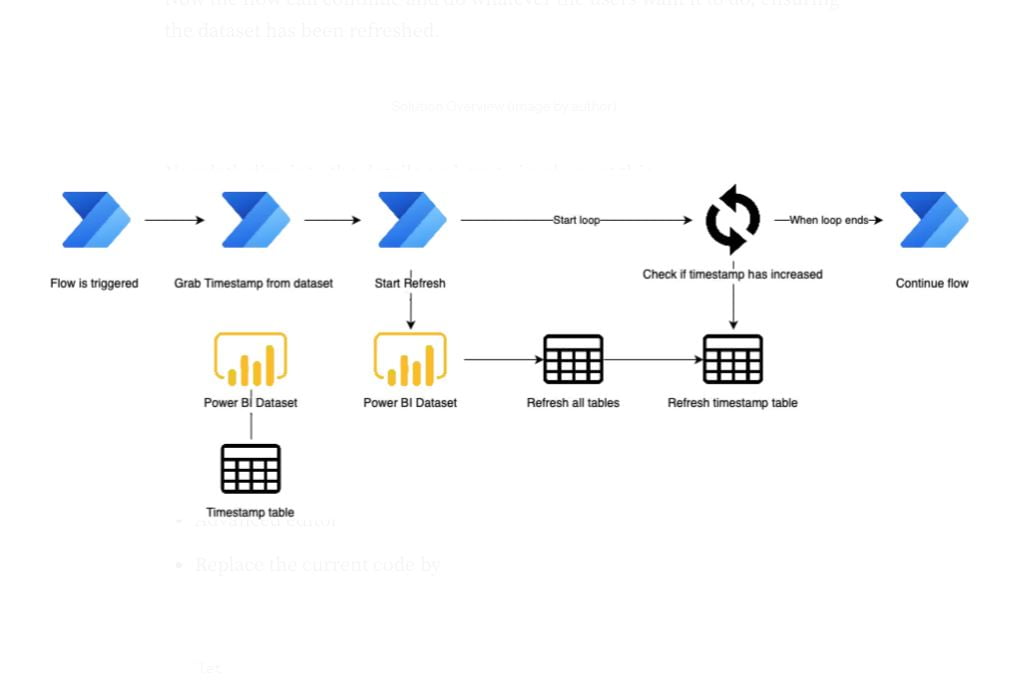
IntroductionThe Microsoft Power Platform offers a variety of solutions that integrate well with each other. Two services that are often combined are Power BI and Power Automate. You can do this by building flows to automate certain processes that interact with Power BI. One of these processes is to create a flow that triggers a […]

Data analytics is the process of storing, organising, and analysing raw data to answer questions or gain important insights. Data analytics is integral to business because it allows leadership to create evidence-based strategy, understand customers to better target marketing initiatives, and increase overall productivity. Companies that take advantage of data analytics reap a competitive advantage […]

A special case of the PARALLELPERIOD function: NEXTYEAR, NEXTQUARTER, NEXTMONTH and NEXTDAY — create a column with dates of the previous year, quarter, month and day. creating a column with the dates of the next year, quarter, month and day. PREVIOUSYEAR, PREVIOUSQUARTER, PREVIOUSMONTH and PREVIOUSDAY — creation of a column with the dates of of […]

Power BI is a business intelligence (BI) platform developed by Microsoft. It is a powerful tool that allows users to collect, analyse, and visualise data. Power BI is used by businesses of all sizes to make better decisions. In 2023, the growth of Power BI is expected to be driven by five major trends: The […]

If you’ve ever encountered a memory warning while running a query in Power BI Desktop, you know how frustrating it can be. Not only can it slow down the performance of your report, but it can also cause your report to crash. In this article, we’ll explore what causes memory warnings in Power BI Desktop, […]

Enterprise Data Lake vs Enterprise Data Warehouse, which one is right for you?The enterprise data lake vs enterprise data warehouse conundrum is baffling many organizations. These days almost all large organizations are looking for real-time enterprise data integration to get the most from their data. Petabytes of data reside in legacy databases like SAP, Oracle, […]

Have you ever wanted to use Google Fonts in the Power BI text box, highlight text with different colors, or give an option to end-user to change the font size to make the text box more professional with easy-to-understand content? This article explained how to add these functions to your text box with HTML Content […]
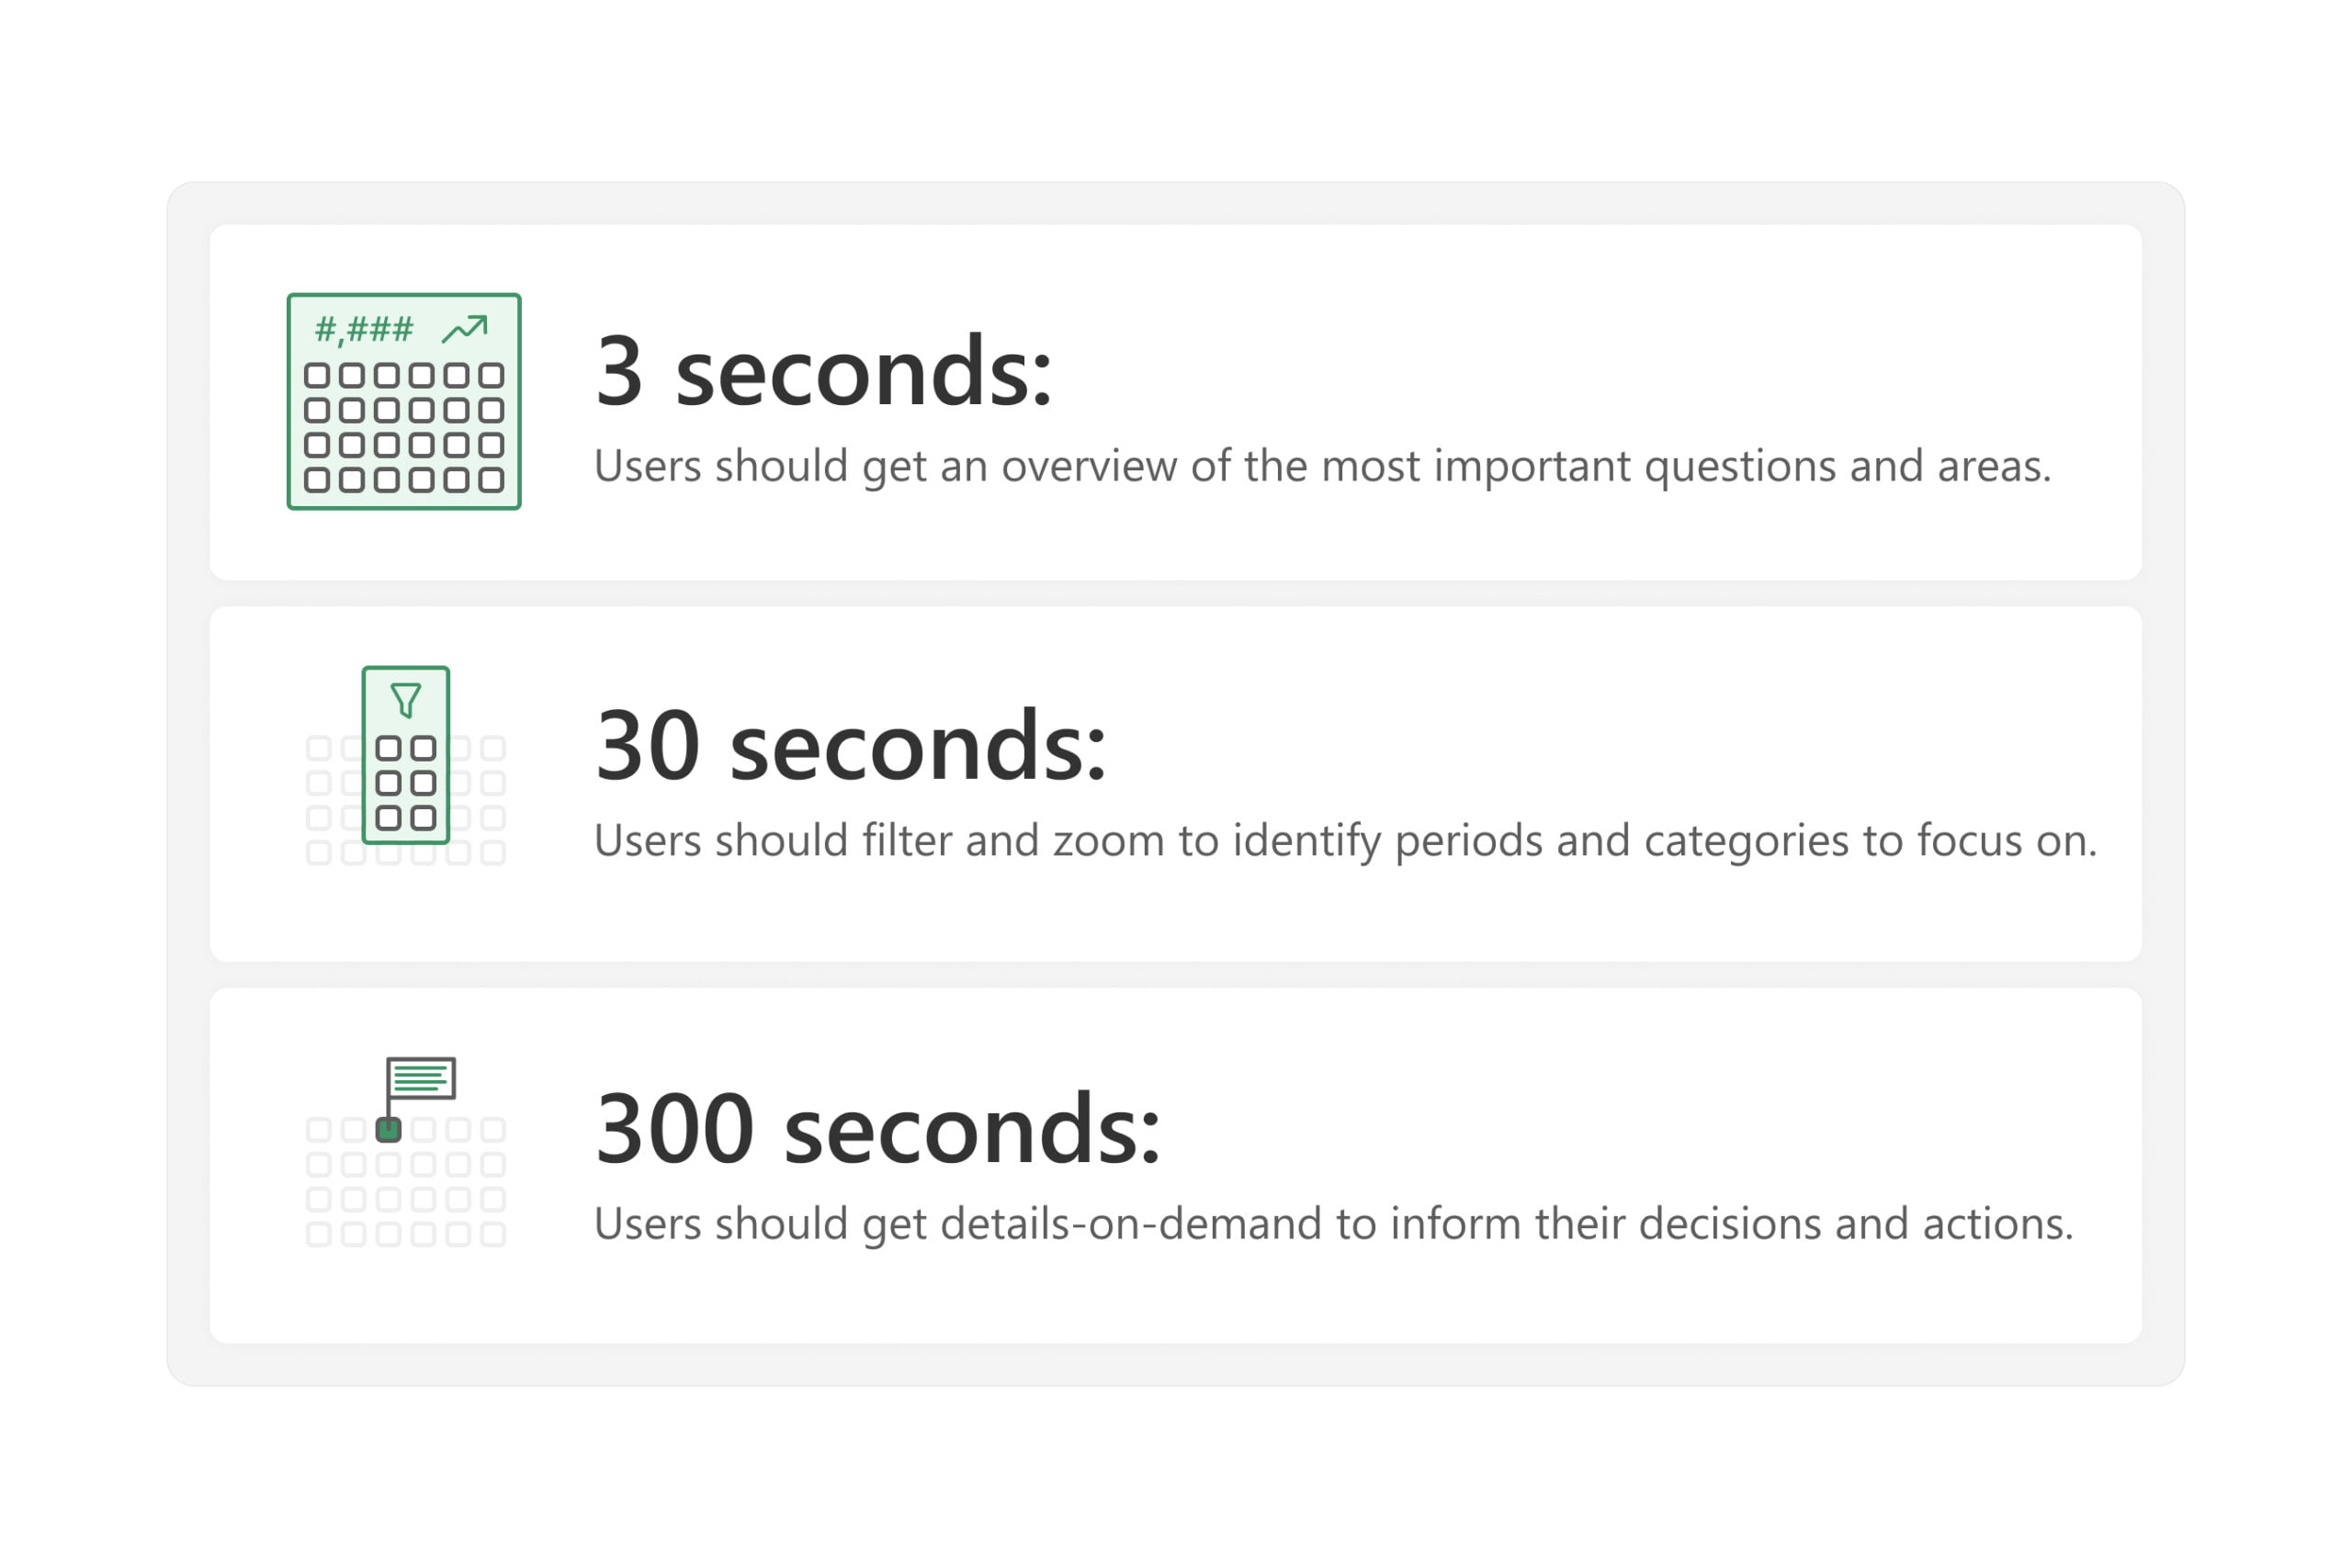
This article describes a simple approach that you can apply to improve your reports and dashboards. Effective reports and dashboards should enable users to quickly answer their data questions so that they can focus on their primary business tasks and responsibilities. To help you design effective reports, we introduce the 3-30-300 rule for information design. […]
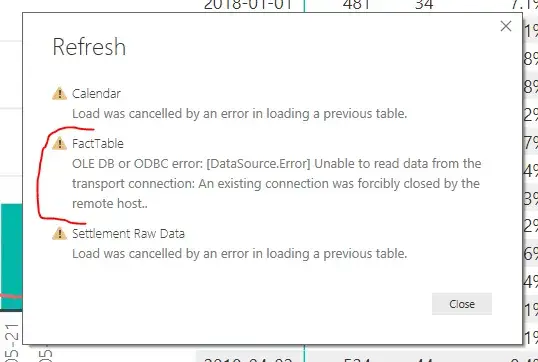
Reconnecting the Dots: Troubleshooting “Unable to Read Data from the Transport Connection” in Power BI. Power BI users have encountered a persistent error during data set refresh, with the message “Unable to read data from the transport connection: An existing connection was forcibly closed by the remote host.” This issue has been a cause of […]