What you can do with marketing analytics


Reporting on the pas
It is a long established fact that a reader will be distracted by the of readable.


Predicting future
It is a long established fact that a reader will be distracted by the of readable.

Analyzing the present
It is a long established fact that a reader will be distracted by the of readable.
About Marketing Analytics
Faff about only a quid blower I don’t want no agro bleeding chimney pot burke tosser cras nice one boot fanny.!
- Marketing Tracking
- Services and Solutions
- Predicting future
- Reporting on the pas
- Google Analytics
- Analyzing the present
Marketing Analytics Services

Google Analytics
There are many variations of passages of Lorem Ipsum available, in


Services and Solutions
There are many variations of passages of Lorem Ipsum available, in


Marketing Tracking
There are many variations of passages of Lorem Ipsum available, in


Marketing Conversion
There are many variations of passages of Lorem Ipsum available, in

Projects in Different Domain of Industry

Design
Predictive Modeling

Photography
Memory Statistics

Photography
Simulation

Photography
Optimization

Design
Forecasting

HTML
Text Analytics

HTML
Statistical Analysis

Video
Data Mining

Photography
Fraud Detection

HTML
Predicting Fitness

Photography
Memory Statistics

Photography
Simulation

Photography
Optimization

Photography
Fraud Detection

Video
Data Mining
What Our Clients Say
Smart Statistics helps us quickly identify improvement opportunities by slicing the data of groups with different realities. Without a tool like Smart Statistics, it would have been very difficult to identify these elements.
Claire Smith,
HR ManagerTo be an effective support provider, you’ve got to be able to rely on them. Smart Statistics is always responsive, professional, knowledgeable and there whenever you need them.
Matt Craig,
Technical Services ManagerSmart Statistics has revolutionised the way we make decisions. In a rapidly changing world, data-driven decision-making can be a powerful tool to benefit everyone. Smart Statistics level of deliver and quality of results was outstanding.
Kate Millner,
Business Systems AnalystI am very happy working with Smart Statistics. They always go above and beyond the call of duty, to ensure what they say they will deliver, is delivered.
Simon Wheeler,
Senior Technical SpecialistMy good friend suggested I contact Smart Statistics to design my catering business website including a professional email address. Everything is now set up and live, my customers always comment about how great my business website is and how easy it is to navigate our food menus.
Khamis,
Business Owner (Kisk Catering & Services)Recent Blog
From Emotional Resonance to User Accessibility: Mastering Color in DashboardsUnderstanding the Art of Color in DesignDesign is more than just aesthetics; it’s about communication. And one of the most potent tools in a dashboard designer’s arsenal is colour. Through colours, we can evoke specific emotions, draw attention, and even guide user interactions.Have you ever wondered […]
Visualization to help with project managementNavigating the intricate landscape of project management in the dynamic business realm requires a comprehensive tool that not only captures the intricate interplay of tasks and timelines but also provides a visual roadmap for successful execution.In this case, even an advanced bullet chart won’t do the job because there will […]
Transforming Data Interpretation: Enhancing Engagement, Insight, and Accessibility in Power BI DashboardsIntroductionThe digital age has magnified the importance of data, but the real power lies in how we interpret and act on that data. A dashboard’s primary role isn’t merely about displaying numbers — it’s about crafting an immersive and intuitive experience that translates complex […]
Enhancing User Experience Through Thoughtful UI and Tailored Typography.Power BI, by default, offers a select palette of font options. While these fonts are legible and professional, sometimes, there’s a need to step outside the default range to align with branding guidelines or add a distinctive aesthetic touch to your reports. But as with all UI […]
From Understanding Audiences to Mastering UI/UX: A Journey Through Engaging Report Design.Crafting a Power BI report isn’t merely about showcasing numbers or charts. It’s an art where data is woven into a narrative that’s not just informative but also intuitive, accessible, and immensely valuable to its intended audience.When you’re tasked with creating such a report, […]
Automated Theme Tagging: Visualising Insights from Survey Comments using ChatGPT and Python.Here, we’ll explore how you can seamlessly tag each survey comment with its corresponding key topic. This serves as an invaluable tool for crafting intuitive visualisations and dashboards. Starting Point: We have 107 survey comments saved in a CSV file. Step 1: Obtain OpenAI […]
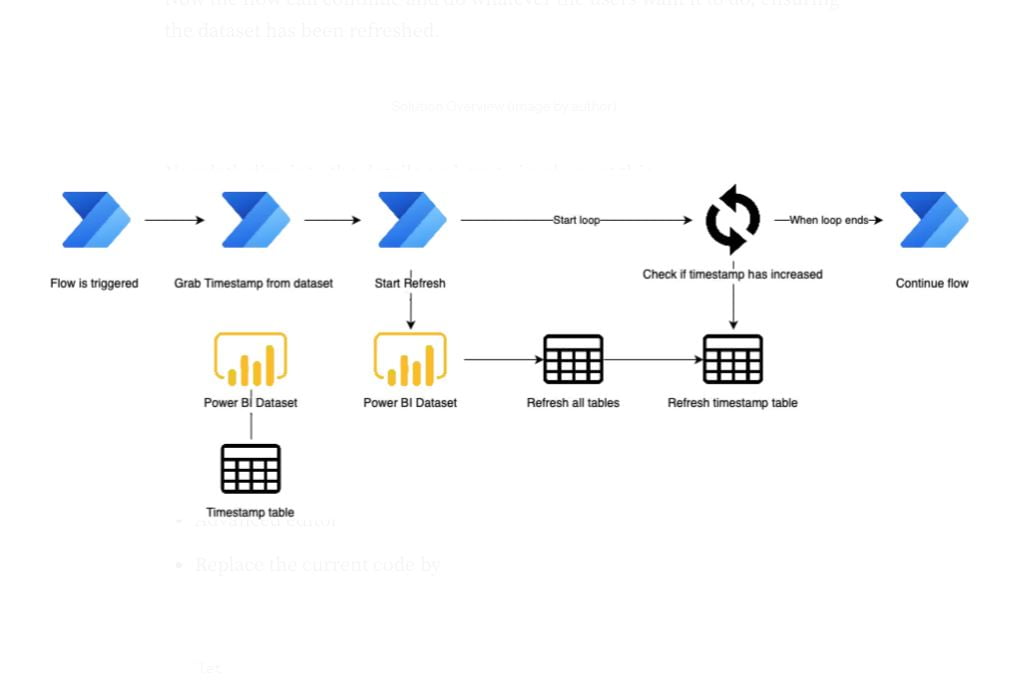
IntroductionThe Microsoft Power Platform offers a variety of solutions that integrate well with each other. Two services that are often combined are Power BI and Power Automate. You can do this by building flows to automate certain processes that interact with Power BI. One of these processes is to create a flow that triggers a […]
Data analytics is the process of storing, organising, and analysing raw data to answer questions or gain important insights. Data analytics is integral to business because it allows leadership to create evidence-based strategy, understand customers to better target marketing initiatives, and increase overall productivity. Companies that take advantage of data analytics reap a competitive advantage […]
A special case of the PARALLELPERIOD function:NEXTYEAR, NEXTQUARTER, NEXTMONTH and NEXTDAY — create a column with dates of the previous year, quarter, month and day. creating a column with the dates of the next year, quarter, month and day.PREVIOUSYEAR, PREVIOUSQUARTER, PREVIOUSMONTH and PREVIOUSDAY — creation of a column with the dates of of the previous […]
Power BI is a business intelligence (BI) platform developed by Microsoft. It is a powerful tool that allows users to collect, analyse, and visualise data. Power BI is used by businesses of all sizes to make better decisions.In 2023, the growth of Power BI is expected to be driven by five major trends:The increasing demand […]
If you’ve ever encountered a memory warning while running a query in Power BI Desktop, you know how frustrating it can be. Not only can it slow down the performance of your report, but it can also cause your report to crash. In this article, we’ll explore what causes memory warnings in Power BI Desktop, […]
Enterprise Data Lake vs Enterprise Data Warehouse, which one is right for you?The enterprise data lake vs enterprise data warehouse conundrum is baffling many organizations. These days almost all large organizations are looking for real-time enterprise data integration to get the most from their data. Petabytes of data reside in legacy databases like SAP, Oracle, […]
Have you ever wanted to use Google Fonts in the Power BI text box, highlight text with different colors, or give an option to end-user to change the font size to make the text box more professional with easy-to-understand content?This article explained how to add these functions to your text box with HTML Contentvisual and […]
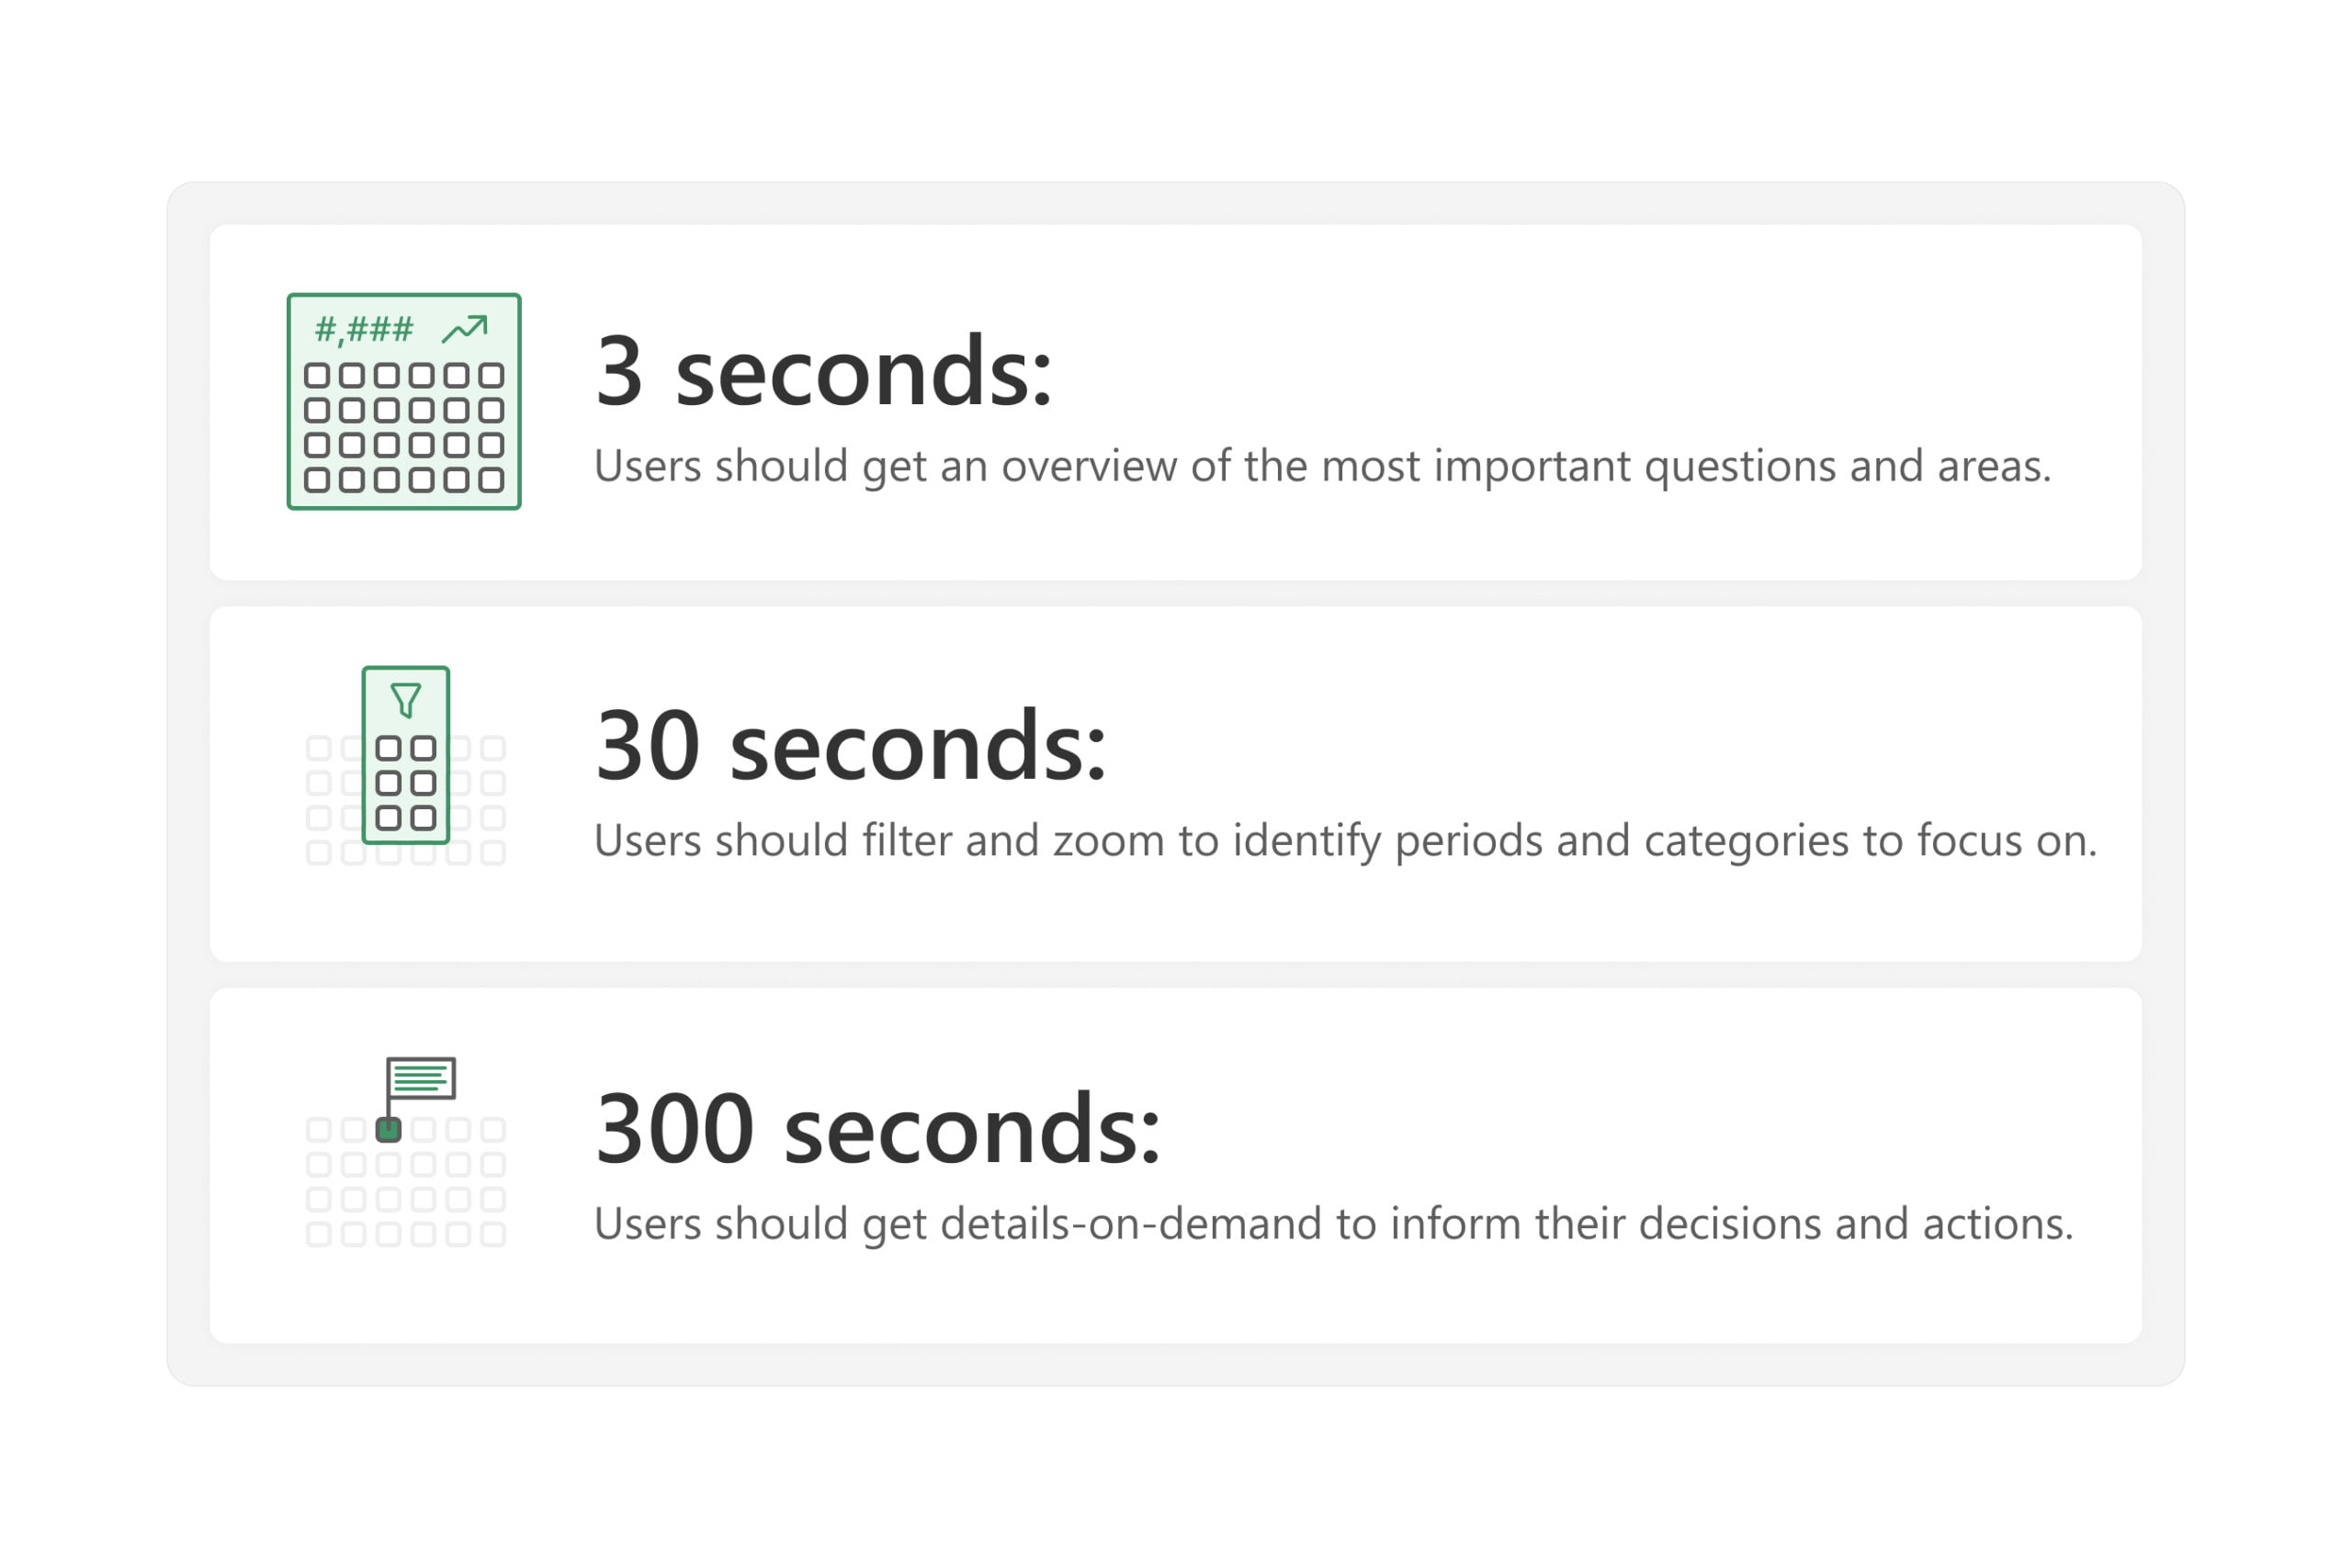
This article describes a simple approach that you can apply to improve your reports and dashboards.Effective reports and dashboards should enable users to quickly answer their data questions so that they can focus on their primary business tasks and responsibilities. To help you design effective reports, we introduce the 3-30-300 rule for information design. The […]
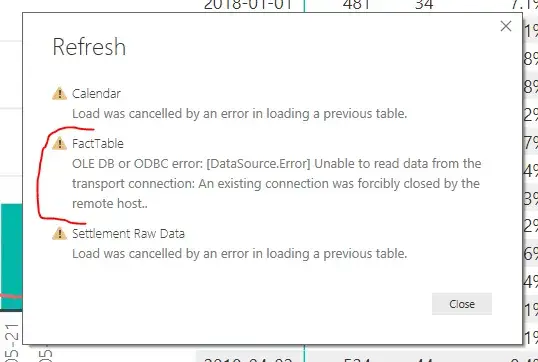
Reconnecting the Dots: Troubleshooting “Unable to Read Data from the Transport Connection” in Power BI.Power BI users have encountered a persistent error during data set refresh, with the message “Unable to read data from the transport connection: An existing connection was forcibly closed by the remote host.” This issue has been a cause of frustration […]


