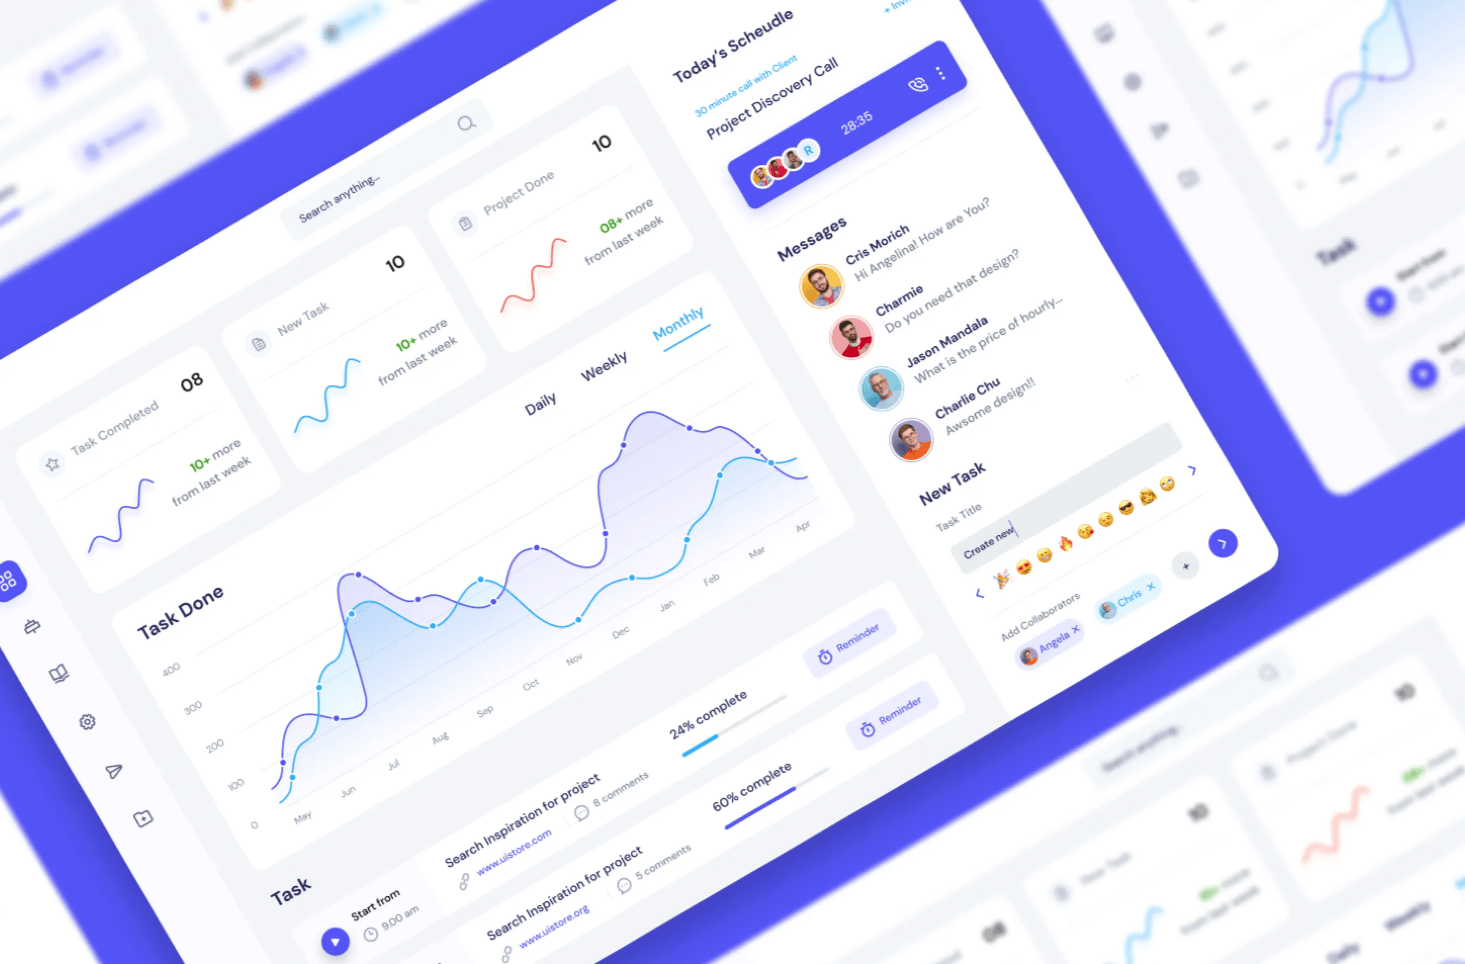
Data analytics is the process of storing, organising, and analysing raw data to answer questions or gain important insights. Data analytics is integral to business because it allows leadership to create evidence-based strategy, understand customers to better target marketing initiatives, and increase overall productivity. Companies that take advantage of data analytics reap a competitive advantage […]
From Understanding Audiences to Mastering UI/UX: A Journey Through Engaging Report Design. Crafting a Power BI report isn’t merely about showcasing numbers or charts. It’s an art where data is woven into a narrative that’s not just informative but also intuitive, accessible, and immensely valuable to its intended audience. When you’re tasked with creating such […]
Transforming Data Interpretation: Enhancing Engagement, Insight, and Accessibility in Power BI Dashboards IntroductionThe digital age has magnified the importance of data, but the real power lies in how we interpret and act on that data. A dashboard’s primary role isn’t merely about displaying numbers — it’s about crafting an immersive and intuitive experience that translates […]
Visualization to help with project management Navigating the intricate landscape of project management in the dynamic business realm requires a comprehensive tool that not only captures the intricate interplay of tasks and timelines but also provides a visual roadmap for successful execution. In this case, even an advanced bullet chart won’t do the job because […]


