

Create a Budget vs Actual Report in Power BI
Budget reporting becomes much more useful when managers can see not only what happened, but how actual performance compares with plan, where the biggest variances sit and whether those differences are improving or deteriorating over time.
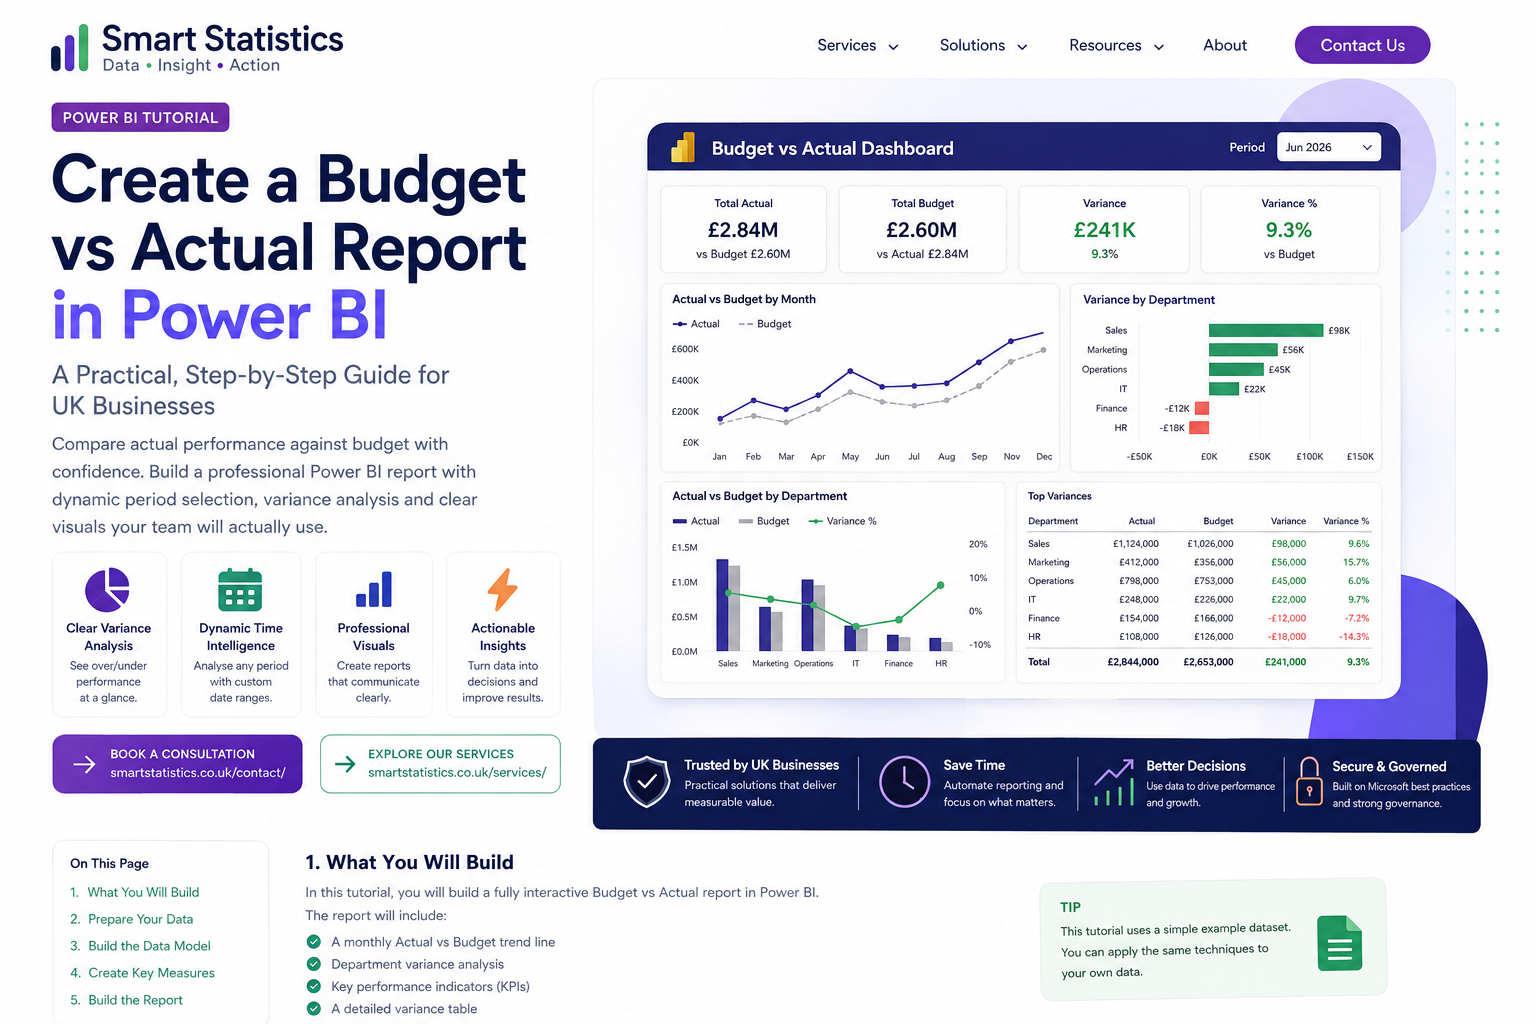
In this tutorial, you will build a professional Budget vs Actual report in Power BI using a simple fact table, a dedicated date table, reusable DAX measures and management-friendly visuals.
A Management Report That Shows Performance Against Plan
The final report will combine headline KPIs, monthly performance, department comparisons and detailed variance analysis in one consistent model.
Monthly Trend
Compare Actual and Budget over time to see whether performance is consistently above or below plan.
- Actual line
- Budget line
- Selected period context
Variance by Department
Rank departments by favourable or adverse variance so management can focus attention quickly.
- Absolute variance
- Variance percentage
- Conditional colour
KPI Cards
Surface the key headline measures senior users need to understand immediately.
- Total Actual
- Total Budget
- Variance and Variance %
Detailed Variance Table
Give users enough detail to investigate which departments or accounts are driving the result.
- Actual and Budget values
- Variance
- Variance percentage
Start with a Simple Structured Fact Table
A clean long-format table makes Budget vs Actual modelling much easier than keeping actual and budget values in separate blocks of spreadsheet columns.
| Column | Description | Illustrative Example |
|---|---|---|
| Date | Transaction or budget period date. | 01/06/2026 |
| Department | Business unit, team or cost centre. | Sales |
| Account | Revenue, cost or reporting account. | Sales Revenue |
| Type | Identifies whether the row is Actual or Budget. | Actual |
| Amount | Numeric value to aggregate. | 125000 |
Build the Model and Measures Before Designing the Dashboard
In this tutorial, assume the transaction table is named FactData and the dedicated calendar table is named DateTable.
Load and clean the source data
Import the source using Power Query and make the data types explicit before loading it to the semantic model.
- Date → Date
- Department → Text
- Account → Text
- Type → Text
- Amount → Decimal or Fixed Decimal
Create a dedicated Date table
DateTable =
ADDCOLUMNS(
    CALENDAR(
        MIN(FactData[Date]),
        MAX(FactData[Date])
    ),
    "Year", YEAR([Date]),
    "Month Number", MONTH([Date]),
    "Month", FORMAT([Date], "MMM"),
    "Year Month", FORMAT([Date], "YYYY-MM")
)
Relate DateTable[Date] to
FactData[Date] using a one-to-many
relationship.
Create the Total Actual measure
Total Actual =
CALCULATE(
    SUM(FactData[Amount]),
    FactData[Type] = "Actual"
)
This measure automatically responds to filters such as date, department and account.
Create the Total Budget measure
Total Budget =
CALCULATE(
    SUM(FactData[Amount]),
    FactData[Type] = "Budget"
)
You now have two reusable base measures for cards, charts, matrices and further calculations.
Create absolute variance
Variance =
[Total Actual] - [Total Budget]
For revenue, a positive variance may be favourable. For costs, the interpretation can be the opposite.
Create variance percentage
Variance % =
DIVIDE(
    [Variance],
    [Total Budget]
)
Format this measure as Percentage. Using
DIVIDE() safely handles zero or
blank budget values.
Add year-to-date measures
Actual YTD =
TOTALYTD(
    [Total Actual],
    DateTable[Date]
)
Budget YTD =
TOTALYTD(
    [Total Budget],
    DateTable[Date]
)
Variance YTD =
[Actual YTD] - [Budget YTD]
If your financial year does not run January to December, adapt the model to your organisation's fiscal calendar.
Build the KPI row
Add four card visuals across the top of the page:
- Total Actual
- Total Budget
- Variance
- Variance %
Create the monthly Actual vs Budget trend
Add a line chart with:
- Axis → DateTable[Year Month]
- Values → [Total Actual]
- Values → [Total Budget]
Use a solid line for Actual and a lighter or dashed treatment for Budget.
Add variance by department
Use a horizontal bar chart with Department on the axis and Variance as the value.
Conditional colours can help users distinguish favourable and adverse departments quickly.
Create the detailed variance matrix
Add Department and Account to the rows, then show:
- Total Actual
- Total Budget
- Variance
- Variance %
This lets managers move from summary to detail without leaving the page.
Add useful slicers
Useful options include:
- Financial year
- Month or period
- Department
- Entity
Avoid adding filters simply because the fields exist. Every slicer should support a real management question.
Reconcile before publishing
Validate the report against known source totals before management relies on it.
- Reconcile total Actual
- Reconcile total Budget
- Check a known department
- Check a known month
- Validate favourable/adverse logic
- Test slicer interactions
Make the Report Trustworthy as Well as Attractive
Budget reporting is often used in management meetings, so ownership, definitions and reconciliation matter just as much as visual design.
Named Ownership
Define who owns the source data, budget assumptions, semantic model and published report.
Document Definitions
Make it clear how Actual, Budget, Variance and favourable/adverse logic are defined.
Control Access
Apply appropriate Power BI workspace, app and row-level security controls for financial information.
Monitor Refresh
Ensure Actual and Budget data are refreshed according to the business reporting timetable.
Power BI Budget vs Actual FAQs
What is a Budget vs Actual report?
Do I need advanced DAX for this report?
Should Budget and Actual be in separate tables?
How should I handle costs where positive variance is bad?
Can I analyse multiple years?
Can this report use Excel budget files?
Can I add forecast as well as budget?
How can Smart Statistics help?
Ready to Turn Budget Data into Clear Management Insight?
Smart Statistics helps UK businesses build Power BI reports that make performance easier to understand, investigate and act on.
Whether you need Budget vs Actual reporting, financial dashboards, DAX improvements, semantic model design or automated data preparation, we can help.