

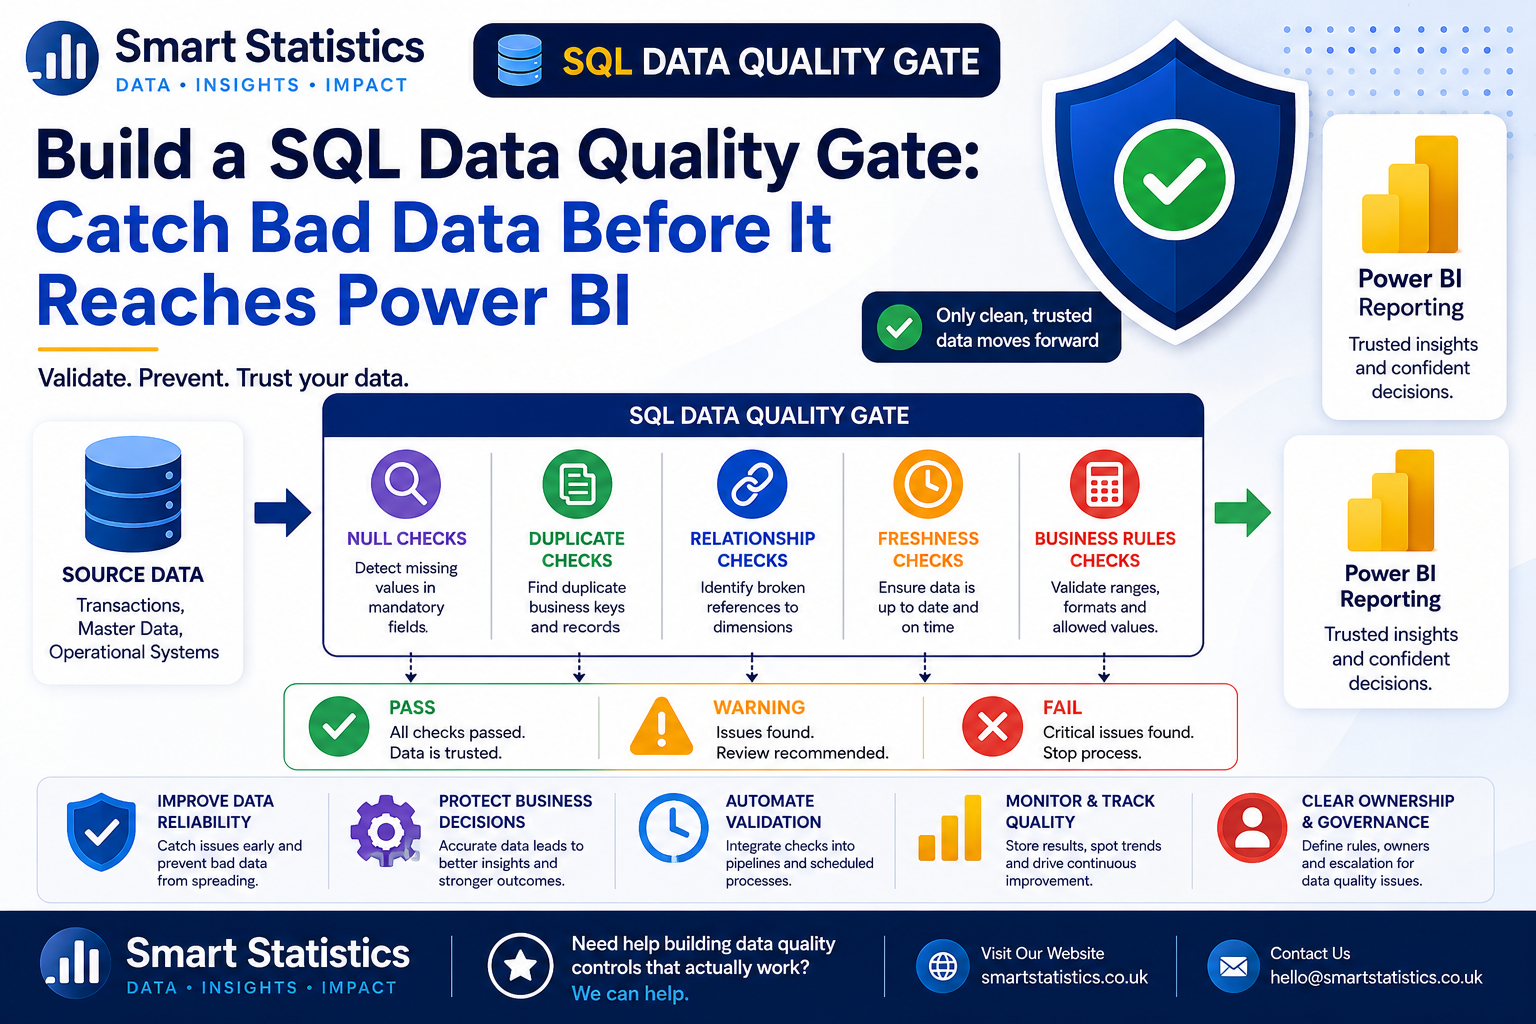
Build a SQL Data Quality Gate: Catch Bad Data Before It Reaches Power BI
Power BI can make unreliable data look extremely convincing. A polished dashboard does not protect the business from missing records, duplicate transactions, broken keys or an upstream system that stopped loading yesterday.
A SQL data quality gate moves those checks upstream. Instead of waiting for somebody to notice a suspicious KPI, you validate the source data before the reporting process treats it as trusted.
A Dashboard Is Only as Reliable as the Data Feeding It
A data quality gate is simply a defined set of checks that decide whether data is fit to move into the next stage of reporting.
Catch Missing Values
Identify mandatory fields that are null or blank before they affect grouping, calculations or filtering.
- Missing customer IDs
- Blank transaction dates
- Empty business-unit codes
Detect Duplicate Keys
Repeated transaction or master-data keys can inflate measures and create ambiguous relationships.
- Duplicate order numbers
- Repeated customer IDs
- Duplicate reference records
Validate Relationships
Find fact-table records whose dimension or master-data keys do not exist.
- Unknown products
- Missing departments
- Invalid customer references
Check Data Freshness
Confirm the source has loaded recently enough for the reporting timetable.
- Latest transaction date
- Latest load timestamp
- Expected daily or hourly SLA
Build the Validation Layer in SQL
The examples below use illustrative tables called FactSales, DimCustomer and DimProduct.
Define which rules are critical
Start with business rules, not SQL syntax. Decide what must be true before reporting data is considered acceptable.
- Every sales row must have a transaction date.
- Every order number must be unique.
- Every customer key must exist in DimCustomer.
- The source must contain data from the expected reporting period.
Check mandatory fields for null values
A simple null check can expose incomplete records before they enter the semantic model.
SELECT
    COUNT(*) AS InvalidRowCount
FROM dbo.FactSales
WHERE
    SaleDate IS NULL
    OR CustomerKey IS NULL
    OR ProductKey IS NULL
    OR Amount IS NULL;
If InvalidRowCount is greater than zero,
the dataset has failed this rule.
Find duplicate business keys
If OrderNumber should uniquely identify a transaction, group by that field and look for counts above one.
SELECT
    OrderNumber,
    COUNT(*) AS DuplicateCount
FROM dbo.FactSales
GROUP BY
    OrderNumber
HAVING
    COUNT(*) > 1;
Check customer referential integrity
Find sales rows containing a CustomerKey that does not exist in the customer dimension.
SELECT
    s.CustomerKey,
    COUNT(*) AS AffectedRows
FROM dbo.FactSales AS s
LEFT JOIN dbo.DimCustomer AS c
    ON s.CustomerKey = c.CustomerKey
WHERE
    c.CustomerKey IS NULL
GROUP BY
    s.CustomerKey;
This can identify failed source-system mappings, late-arriving dimension records or transformation defects.
Check product relationships too
SELECT
    s.ProductKey,
    COUNT(*) AS AffectedRows
FROM dbo.FactSales AS s
LEFT JOIN dbo.DimProduct AS p
    ON s.ProductKey = p.ProductKey
WHERE
    p.ProductKey IS NULL
GROUP BY
    s.ProductKey;
The same pattern can be reused for departments, cost centres, suppliers, projects or other required dimensions.
Check whether the data is fresh enough
SELECT
    MAX(SaleDate) AS LatestSaleDate
FROM dbo.FactSales;
You can compare the latest date against the expected business date.
SELECT
    CASE
        WHEN MAX(SaleDate) >= CAST(DATEADD(DAY, -1, GETDATE()) AS date)
            THEN 'PASS'
        ELSE 'FAIL'
    END AS FreshnessStatus
FROM dbo.FactSales;
Check invalid numeric values
Business rules can catch technically valid rows that are still operationally suspicious.
SELECT
    COUNT(*) AS InvalidAmountCount
FROM dbo.FactSales
WHERE
    Amount < 0;
Whether negative values are invalid depends on your data. Returns or credit notes may legitimately be negative, so build rules around the business meaning.
Create a reusable validation summary
Instead of reviewing separate result sets manually, return a simple validation table.
SELECT
    'Missing mandatory values' AS CheckName,
    COUNT(*) AS IssueCount,
    CASE
        WHEN COUNT(*) = 0 THEN 'PASS'
        ELSE 'FAIL'
    END AS Status
FROM dbo.FactSales
WHERE
    SaleDate IS NULL
    OR CustomerKey IS NULL
    OR ProductKey IS NULL
    OR Amount IS NULL

UNION ALL

SELECT
    'Duplicate order numbers',
    COUNT(*),
    CASE
        WHEN COUNT(*) = 0 THEN 'PASS'
        ELSE 'FAIL'
    END
FROM (
    SELECT
        OrderNumber
    FROM dbo.FactSales
    GROUP BY
        OrderNumber
    HAVING
        COUNT(*) > 1
) AS d;
Extend the pattern with the other checks required for your reporting process.
Store validation history
For operational monitoring, create a table that records when each validation ran and what happened.
CREATE TABLE dbo.DataQualityResults
(
    ResultId        int IDENTITY(1,1) PRIMARY KEY,
    RunTimestamp    datetime2 NOT NULL,
    CheckName       varchar(200) NOT NULL,
    Status          varchar(20) NOT NULL,
    IssueCount      int NOT NULL
);
Historical results allow you to see whether source quality is improving or whether the same problem keeps returning.
Decide what happens when a check fails
A quality check only becomes a gate when something responds to the result.
- Critical failure → stop downstream processing.
- Warning → continue but notify the data owner.
- Informational issue → log for later review.
Connect the validation result to your pipeline
The SQL checks can be called from orchestration tools such as SQL Agent, Power Automate, Azure Data Factory or Microsoft Fabric Data Factory depending on your architecture.
The important pattern is:
- Load or stage the source data.
- Run validation checks.
- Inspect critical statuses.
- Continue to Power BI only when the required conditions pass.
Surface failures clearly
Do not hide failed quality checks inside technical logs that business reporting owners never see.
Capture at least:
- Check name
- Status
- Number of affected records
- Timestamp
- Data owner or escalation route
Not Every Data Issue Should Have the Same Consequence
A simple severity model helps teams distinguish between a dataset that is unusable and one that merely needs attention.
Reporting can continue
All critical checks meet the defined threshold and the data is suitable for downstream processing.
Continue with visibility
The issue is not severe enough to stop reporting, but the data owner should investigate it.
Stop the downstream process
A critical rule has failed and publishing the resulting report could mislead users.
Quality Checks Need Ownership as Well as SQL
Automated validation is most effective when everybody knows who owns the rule, what failure means and who is responsible for resolving it.
Named Owners
Assign an owner for the source, validation rule and reporting consequence.
Document Rules
Explain what the check validates and why the threshold matters to the business.
Control Changes
Review rule changes when source systems, business definitions or reporting requirements change.
Monitor Trends
Use historical quality results to identify recurring source problems and measure improvement.
SQL Data Quality FAQs
Why run data quality checks before Power BI?
Which SQL data quality checks should I start with?
Should a failed quality check stop the Power BI refresh?
Can these checks run automatically?
Should I delete duplicate records automatically?
Can Power BI display the validation results too?
Does this replace database constraints?
How can Smart Statistics help?
Are Data Problems Reaching Your Reports Before Anyone Notices?
Smart Statistics helps UK businesses build reliable reporting processes where data quality, transformation and Power BI work together rather than being treated as separate problems.
We can help with SQL validation, reporting architecture, Power BI semantic models, automated data pipelines and practical governance controls.