

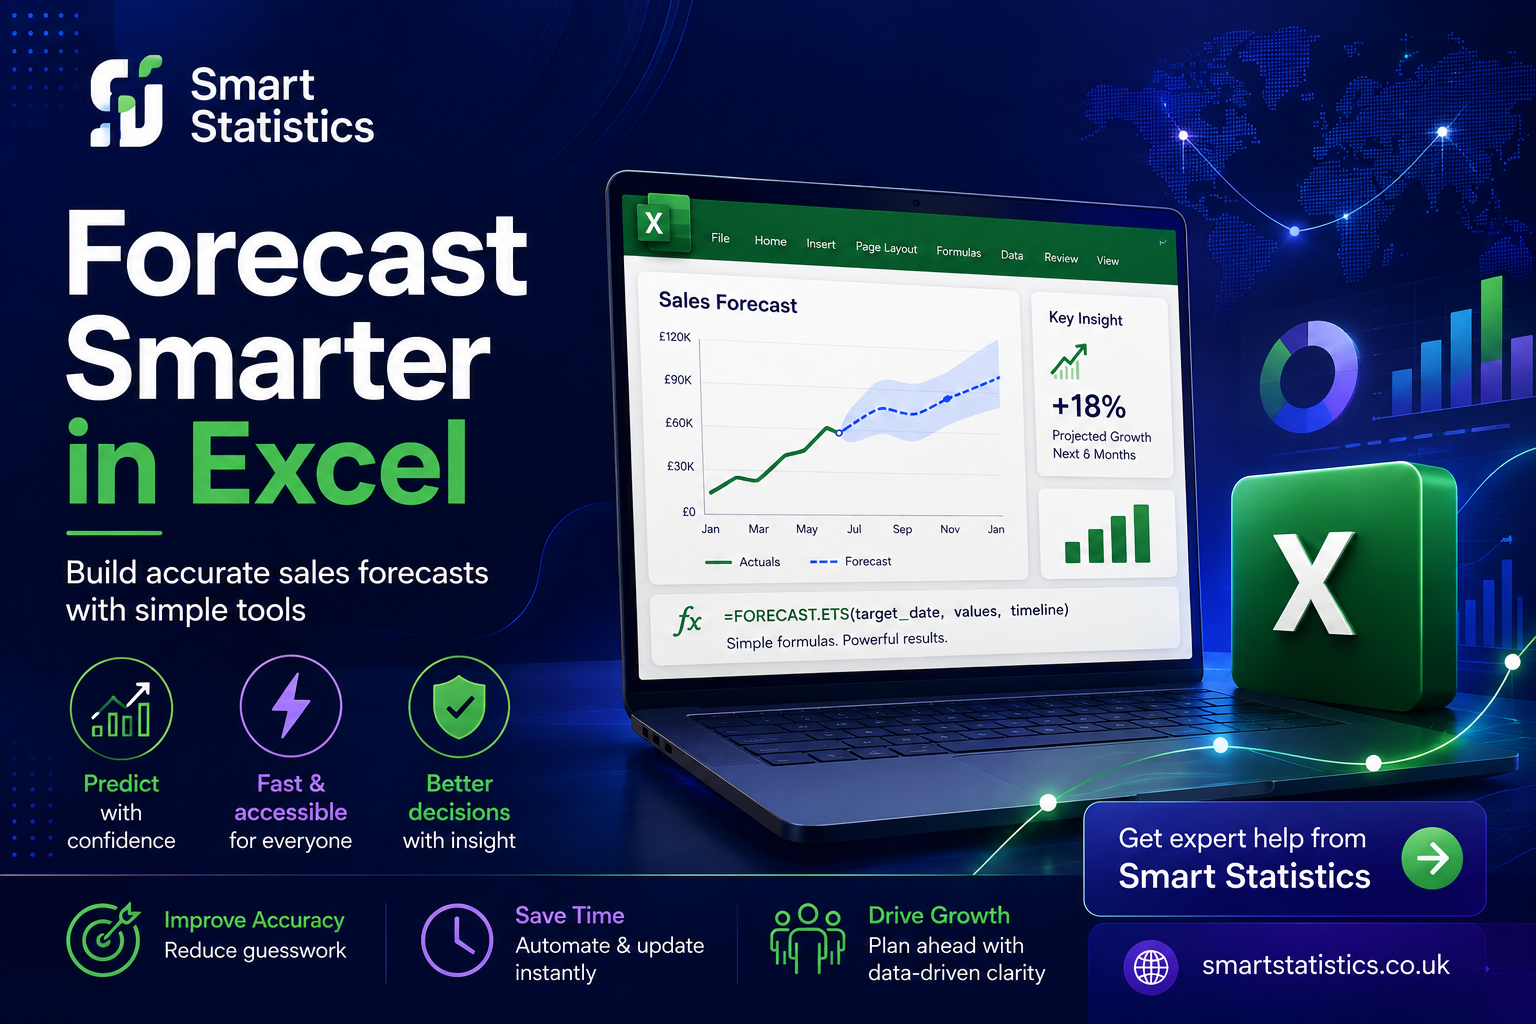
Forecast Smarter in Excel with FORECAST.ETS
Build a practical forward-looking sales forecast from historical data, quantify uncertainty and turn the output into something managers can actually use for planning.
=FORECAST.ETS(target_date, values, timeline)
Extend historical patterns into future periods.
Add confidence intervals instead of one false-precision number.
Understand whether recurring patterns influence the forecast.
Test how the method behaves against actual historical periods.
A forecast should support a decision — not just create another chart.
Many businesses already have historical sales data in Excel. What they often do not have is a repeatable method for turning that history into a forward-looking view.
A sales forecast can help finance teams plan cash flow, operations teams anticipate capacity, purchasing teams prepare stock requirements and managers identify where expected performance is moving away from target.
The important point is that a statistical forecast is an estimate based on historical behaviour. It is not the same thing as a budget, sales target or management commitment.
- Forecast: what historical behaviour suggests may happen.
- Target: what the business wants to achieve.
- Scenario: what may happen if assumptions or conditions change.
Illustrative readiness panel
Get the historical data into a shape Excel can trust.
Forecasting quality depends heavily on the structure and consistency of the historical time series. A sophisticated formula cannot compensate for fundamentally unreliable inputs.
Use a consistent timeline
Monthly data should normally contain one consistently spaced monthly observation. Weekly data should follow a consistent weekly structure.
Remove avoidable noise
Review duplicated periods, one-off manual adjustments, obvious data-entry errors and other issues that could distort the historical pattern.
Use enough relevant history
A forecast needs sufficient history to represent the patterns you expect to continue. More data is not automatically better if the old periods reflect a fundamentally different business.
Build the Excel forecast
The example below uses monthly sales, but the same structure can be adapted for demand, revenue, order volume, stock usage or other time-based measures.
Structure the historical data
Create two core columns: one containing the timeline and one containing the historical value to forecast.
| Month | Actual Sales |
|---|---|
| 01 January 2025 | £72,000 |
| 01 February 2025 | £76,500 |
| 01 March 2025 | £75,400 |
| 01 April 2025 | £81,200 |
These values are illustrative. In your own workbook, continue the historical timeline for all relevant periods.
For example, monthly observations should be represented as a consistent monthly timeline rather than a mixture of daily, weekly and month-end dates.
Extend the timeline into future periods
Add the future months you want to forecast beneath the historical period.
If your historical dates finish in December 2026, the next forecast periods might be January 2027, February 2027, March 2027 and so on.
The target date passed into FORECAST.ETS must represent a future point on the same logical timeline.
Calculate the forecast with FORECAST.ETS
Assume historical dates are in A2:A25, historical sales are in B2:B25 and the future target date is in E2.
The first argument is the future date being predicted. The second argument contains the historical sales values. The third argument contains the historical timeline.
Copy the formula down for each future month in the forecasting horizon.
The optional seasonality argument can also be controlled explicitly where there is a valid business reason to do so.
Add a confidence interval
A single forecast value can create a false impression of certainty. A confidence interval makes the range around the prediction visible.
If the forecast is stored in F2 and the confidence interval in G2, you can calculate the lower and upper forecast limits as:
It is a statistical range produced from the model and historical data. Unexpected events, structural business changes and external shocks can still move actual performance outside that range.
Inspect the detected seasonality
You can ask Excel to return the seasonal pattern it detects in the historical series.
For monthly data, a detected seasonal period may indicate that the pattern repeats across a number of months. Do not accept the result mechanically: compare it with what you know about the business.
Retail peaks, annual contract cycles, school holidays, operational shutdowns or seasonal demand can all influence the pattern.
Validate the method using known historical periods
Before trusting the next six months, test how the forecasting method would have performed against periods where you already know the actual result.
One simple approach is to withhold several recent periods, forecast them using only the earlier history, then compare forecast versus actual.
If actual sales are in C2 and the forecast is in D2, a simple absolute percentage error calculation is:
Format the result as a percentage and review the error across multiple periods rather than relying on one favourable result.
Build a management view, not just a formula
The final output should help a decision-maker quickly understand three things: what is expected, how uncertain the expectation is and where action may be required.
| Month | Forecast | Lower Range | Upper Range | Target | Forecast vs Target |
|---|---|---|---|---|---|
| Jan | £98,000 | £90,000 | £106,000 | £102,000 | -£4,000 |
| Feb | £101,500 | £92,500 | £110,500 | £104,000 | -£2,500 |
| Mar | £105,000 | £95,000 | £115,000 | £105,000 | £0 |
The figures above are illustrative.
Turn one forecast into three planning scenarios.
A useful management forecast should support discussion around uncertainty and action rather than presenting one number as inevitable.
Lower planning range
Use the lower confidence boundary or a business-defined downside assumption to understand resource, stock or cash-flow exposure.
Statistical forecast
Use the central ETS forecast as the baseline view of expected performance, subject to known business context.
Upper planning range
Use the upper range or a justified commercial scenario to examine capacity, inventory and delivery requirements if performance exceeds the baseline.
A better formula cannot rescue a weak forecasting process.
Forecasting dirty data
Duplicates, inconsistent dates and unexplained manual adjustments can produce misleading patterns.
Ignoring structural change
A historical pattern may no longer be relevant after a major pricing change, acquisition, lost contract or operational redesign.
Hiding uncertainty
Presenting £102,438 as though it were certain is less useful than showing a sensible forecast range.
Confusing forecast and target
A target is a management objective. A statistical forecast is an estimate. Comparing the two creates useful insight.
Excel can be an excellent forecasting starting point.
For a focused planning requirement, a well-structured Excel forecast can be quick to build, easy to understand and perfectly adequate.
As the forecasting process grows, however, you may need something more controlled — particularly if multiple teams, products, sites, scenarios or data sources are involved.
That may mean combining Excel with Power Query, Power BI, SQL, Microsoft Fabric or a more structured planning process.
- Multiple people maintain separate versions of the model.
- Forecasts need to combine many products, customers or sites.
- The workbook requires increasingly complex manual preparation.
- Management needs automated, governed forecasting visibility.
Excel forecasting FAQs
What does FORECAST.ETS do in Excel?
FORECAST.ETS predicts future values from historical time-series data using exponential smoothing. It is particularly useful where trend and recurring seasonal behaviour may exist in the historical series.
Can Excel create a forecast without writing formulas?
Yes. Excel's Forecast Sheet feature can create a new worksheet containing historical values, forecast values and a chart. The formula-based approach is useful when you want more control over how the forecast is integrated into an existing reporting model.
How much historical data should I use?
Use enough history to represent the trend and seasonal behaviour that matters to the business. The right amount depends on whether the data is daily, weekly or monthly and whether older periods remain representative of the current business.
Why should I include a confidence interval?
Forecasts contain uncertainty. A confidence interval communicates that uncertainty and gives decision-makers a more useful planning range than a single point estimate.
Should a statistical forecast replace the company budget?
No. A statistical forecast estimates what may happen based on historical patterns. A budget or target represents what the organisation intends to achieve. Comparing the two can highlight emerging risks or opportunities.
Turn historical data into a clearer view of what may happen next.
Smart Statistics helps UK businesses improve forecasting, reporting and decision-making using practical solutions across Excel, Power BI, automation and modern data platforms. If forecasting is still driven by disconnected spreadsheets, manual assumptions or repeated guesswork, we can help you design a more controlled approach.