

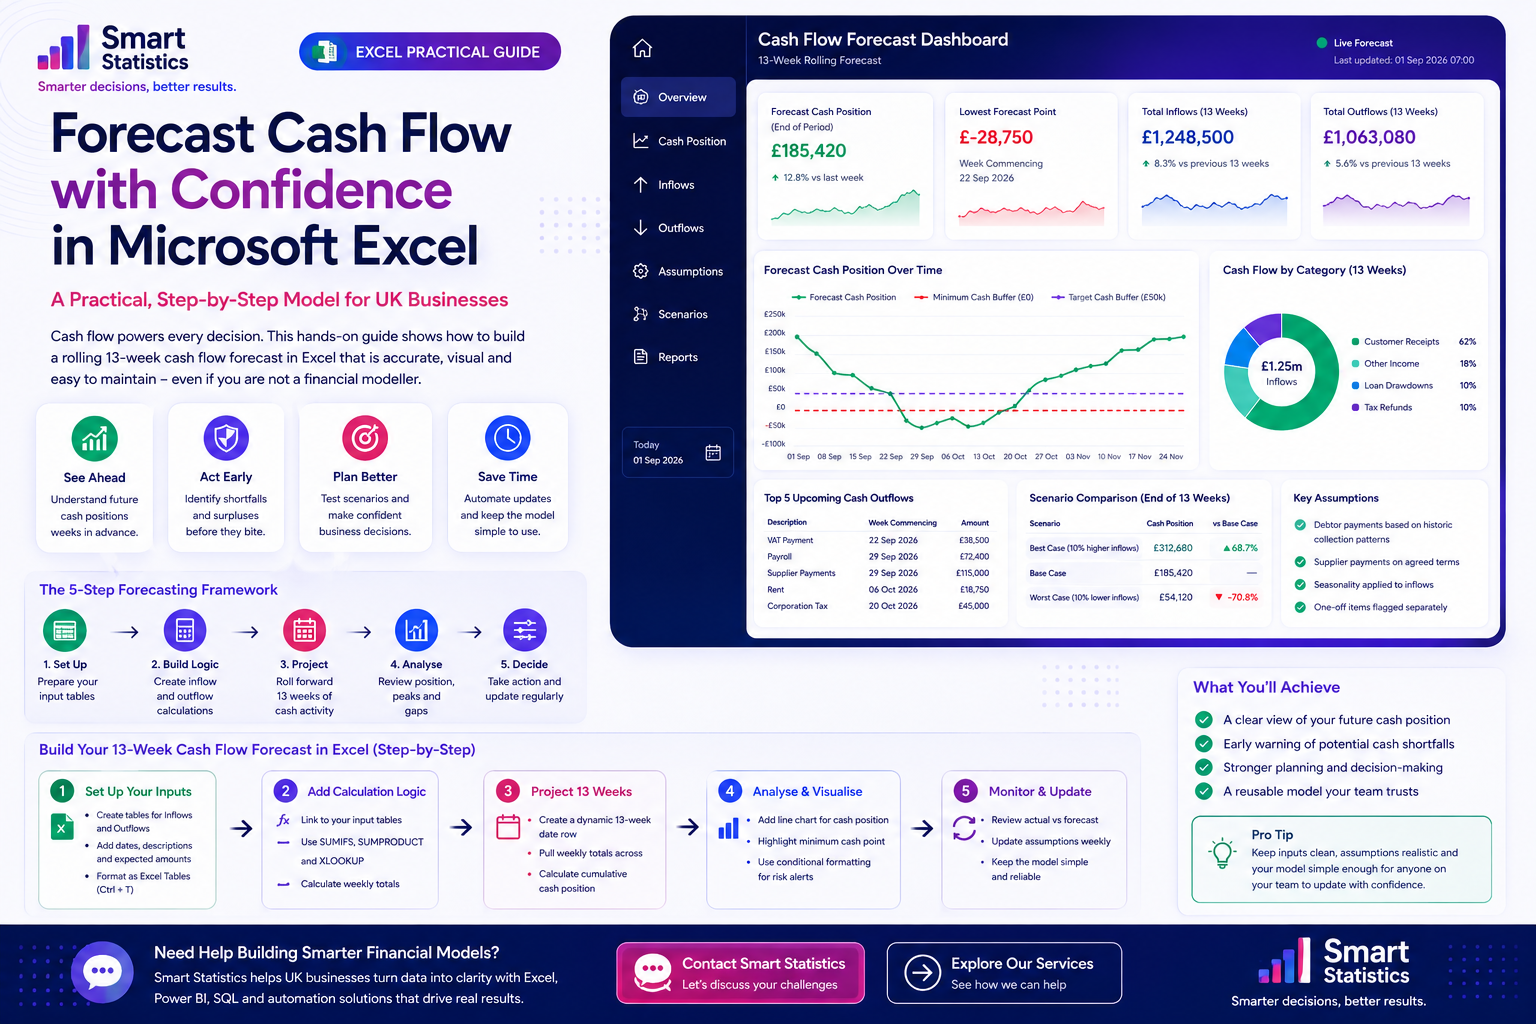
Forecast Cash Flow with Confidence in Microsoft Excel
A profitable business can still experience a cash problem if money arrives later than payments leave the bank.
That is why a useful cash forecast should do more than show a monthly total. It should reveal when cash becomes tight, what causes the pressure and how much room the business has to react.
This tutorial shows how to build a rolling 13-week Excel model that is structured, maintainable and useful for real management decisions.
Forecast Cash Position
Illustrative 13-week exampleUpcoming Cash Pressure
Example payment calendarShort Enough to Be Detailed. Long Enough to See Trouble Coming.
A 13-week horizon gives management a practical quarter-ahead view while retaining enough weekly detail to see the timing of individual cash movements.
See Liquidity Early
A forecast can expose a temporary cash deficit weeks before the bank balance reaches that point.
Understand Timing
Two months can have identical totals while producing very different cash pressure because of payment timing.
Test Decisions
Management can see the effect of delayed receipts, accelerated payments or unusual expenditure.
Create a Weekly Rhythm
A rolling model encourages finance teams to replace assumptions with actual information every week.
Separate Inputs, Logic and Reporting Before Writing a Single Formula
The easiest way to make a financial model difficult to maintain is to mix assumptions, calculations and manual overrides in the same area.
Inputs
Customer receipts, payments and assumptions.
Weekly Calendar
Dynamic 13-week reporting periods.
Calculations
Weekly inflows, outflows and closing cash.
Scenarios
Best case, base case and downside assumptions.
Dashboard
Management-facing cash visibility.
Build the Forecast Step by Step
Create structured inflow and outflow tables
Start with two Excel Tables rather than manually typing numbers into the forecast.
Example table: tblInflows
- ExpectedDate
- Customer
- Description
- Category
- Amount
- Confidence
Example table: tblOutflows
- ExpectedDate
- Supplier
- Description
- Category
- Amount
- Committed
Create a rolling 13-week calendar
Decide which day starts your reporting week. Monday is a common choice.
If cell B2 contains the first week commencing date, the next week can simply be:
=B2+7
Copy the formula across until you have 13 weekly periods.
Alternatively, if you are using a modern Excel version with dynamic arrays:
=SEQUENCE(1,13,$B$2,7)
Calculate weekly expected cash inflows
Suppose the week commencing date is in B$5.
Sum all expected receipts that fall inside the seven-day period:
=SUMIFS(
    tblInflows[Amount],
    tblInflows[ExpectedDate],">="&B$5,
    tblInflows[ExpectedDate],"<"&B$5+7
)
You can repeat the same pattern by category.
=SUMIFS(
    tblInflows[Amount],
    tblInflows[ExpectedDate],">="&B$5,
    tblInflows[ExpectedDate],"<"&B$5+7,
    tblInflows[Category],$A10
)
Calculate weekly cash outflows
Apply the same weekly logic to your payment table:
=SUMIFS(
    tblOutflows[Amount],
    tblOutflows[ExpectedDate],">="&B$5,
    tblOutflows[ExpectedDate],"<"&B$5+7
)
Typical outflow categories could include:
- Payroll
- Supplier payments
- VAT
- PAYE / NI
- Corporation tax
- Rent
- Loan repayments
- Insurance
- Capital expenditure
Use positive values in your input table and subtract total outflows in the forecast logic. That keeps source data easier to understand.
Roll the cash balance forward
The first forecast week starts from your opening bank position.
Closing Cash =
Opening Cash
+ Total Inflows
- Total Outflows
In the next week:
Next Opening Cash =
Previous Week Closing Cash
Example:
=B20+B14-B18
If:
- B20 = opening cash
- B14 = weekly inflows
- B18 = weekly outflows
Then the next week's opening balance can simply reference the previous closing balance.
Add minimum cash-buffer warnings
A positive bank balance does not necessarily mean the business is comfortable.
Management may want a minimum operational cash buffer — for example, enough to cover payroll, VAT and critical suppliers.
If the minimum buffer is stored in $B$3:
=IF(
    B25<$B$3,
    "Below Buffer",
    "OK"
)
Apply conditional formatting so that weeks below the threshold become visually obvious.
Add scenario assumptions
A forecast becomes much more useful when management can ask:
- What happens if customer collections are 10% lower?
- What happens if supplier payments move forward?
- What happens if a major receipt is delayed two weeks?
- How much cash headroom remains under a downside case?
Create assumption cells such as:
Inflows Adjustment = 90%
Outflows Adjustment = 105%
Then apply those assumptions:
=BaseInflows*InflowsAdjustment
=BaseOutflows*OutflowsAdjustment
Build the management dashboard
Keep the reporting page focused on decisions rather than showing the entire workbook.
Useful headline indicators include:
- Current cash position
- Lowest forecast cash position
- Week of lowest cash point
- 13-week inflows
- 13-week outflows
- Minimum cash buffer
- Weeks below buffer
- Largest upcoming payments
The most useful visual is often a simple line chart showing cash position against:
- Minimum operating buffer
- Zero cash line
- Optional target buffer
Stress-Test the Cash Position
Use the controls below to see how changing receipts and payments can alter an illustrative forecast.
Scenario Assumptions
These controls are illustrative and demonstrate how management assumptions can change forecast outcomes.
Illustrative Forecast Result
The calculations below are simplified for the interactive demonstration.
A Forecast Is Only Useful If People Trust It
Financial models often fail because assumptions become stale, manual overrides are hidden or nobody knows which version is the real forecast.
Document Assumptions
Record where payment dates, collection assumptions and forecast percentages come from.
Update Weekly
Replace assumptions with actual information and roll the forecast horizon forward.
Protect Formula Cells
Keep input areas clearly separated from calculation logic to reduce accidental changes.
Compare Forecast vs Actual
Use historic forecast accuracy to improve collection assumptions and payment timing.
Excel Cash Flow Forecast FAQs
Why use a 13-week cash flow forecast?
Can Excel handle a professional cash forecast?
How often should the model be updated?
Should customer receipts use invoice due dates?
Should the forecast include VAT and tax payments?
Can Power Query improve the model?
When should we move from Excel to Power BI?
How can Smart Statistics help?
Cash Problems Are Easier to Solve Three Weeks Before They Happen.
Smart Statistics helps UK businesses turn finance data into practical forecasting, reporting and decision-support solutions.
Whether your current cash forecast is a manually updated spreadsheet or you are ready to connect Excel, Power BI and automation, the objective is the same: reliable visibility before decisions become urgent.