

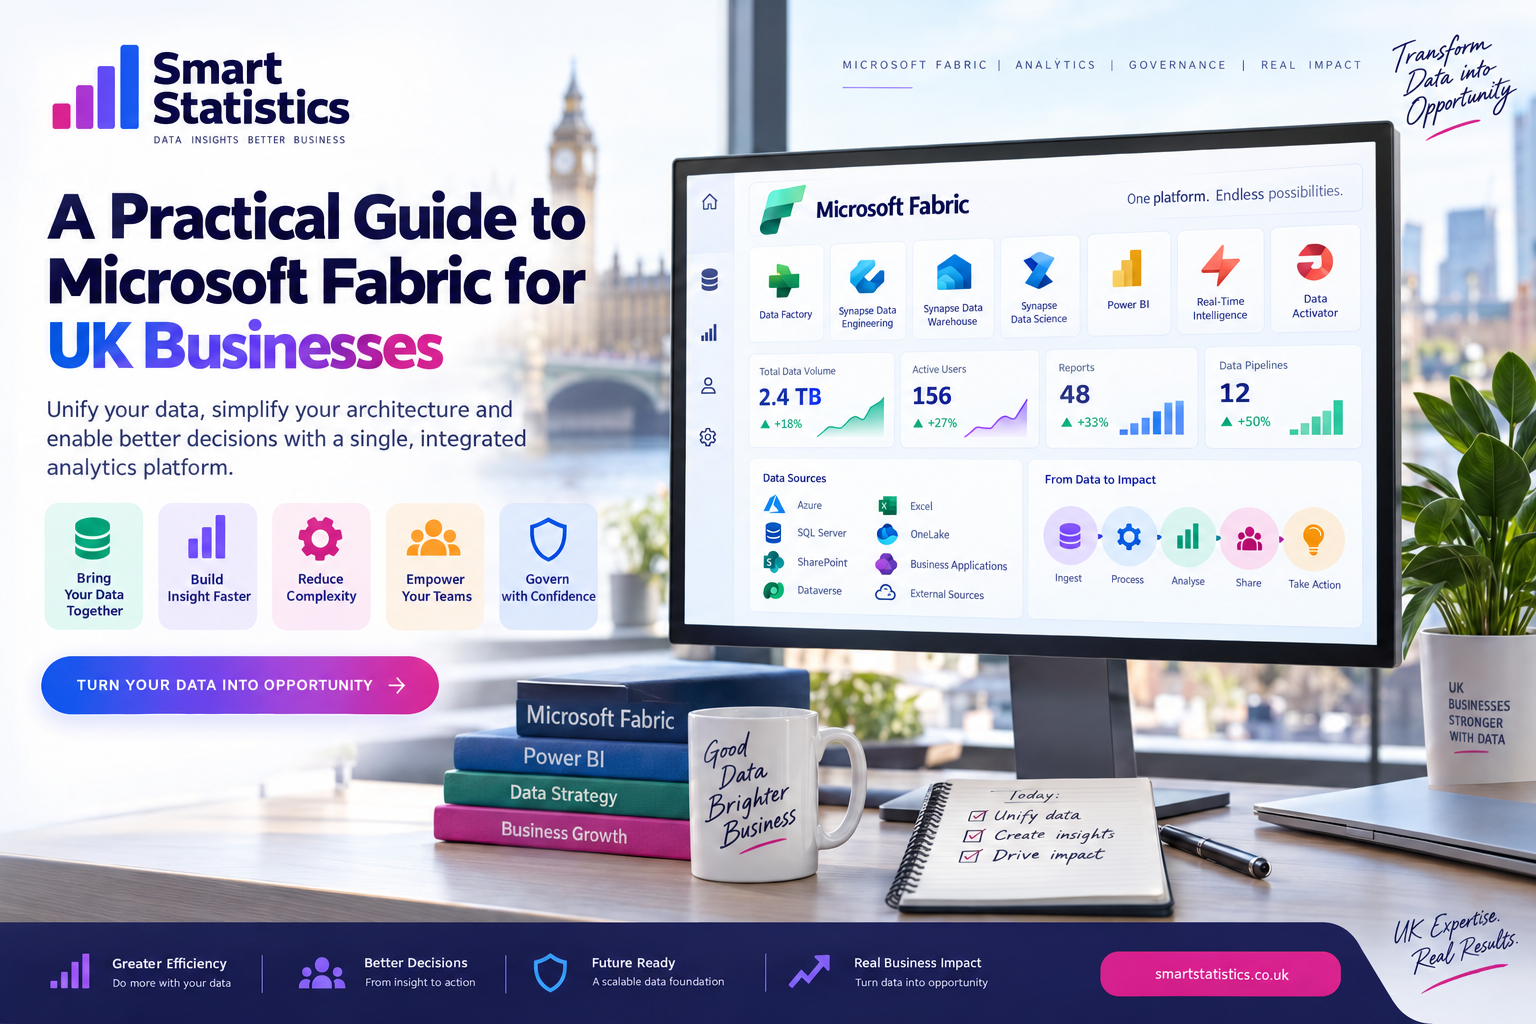
A Practical Guide to Microsoft Fabric for UK Businesses
Many businesses do not have a shortage of data. They have a shortage of connected, reusable and trusted data.
Sales lives in one system. Finance exports another file. Operational teams maintain spreadsheets. Power BI reports apply their own transformations. Analysts spend time stitching everything together before the business can ask meaningful questions.
Microsoft Fabric creates an opportunity to bring more of that analytical journey into a coherent platform — but the best starting point is not to migrate everything. It is to solve one valuable business problem end to end.
Pilot Data Sources
From Data to Decision
Prove one complete analytical journey before expanding the platform across every source, department and report.
Fabric Becomes Interesting When Your Analytics Journey Is Fragmented
The business case is not simply that Microsoft has another analytics product. The opportunity is to reduce repeated movement, duplicated logic and disconnected analytical workloads.
Too Many Handoffs
Data moves from a source system into exports, spreadsheets, databases and reporting tools before reaching the person who needs the answer.
Repeated Logic
The same customer categories, cleaning rules and financial calculations are rebuilt independently across several reports.
Ownership Gaps
Nobody is completely sure whether the analyst, report owner, source-system team or IT department owns a data problem.
Governance Arrives Late
Security, definitions and quality rules are often applied after reports are already being distributed instead of being designed into the analytical pipeline.
Build One Complete Path from Source to Decision
A useful pilot should test the whole analytical chain rather than proving one technical feature in isolation.
Source
Start with the systems required for one business question.
Ingest
Make data movement repeatable rather than manually exported.
Curate
Standardise records into reusable analytical structures.
Model
Create relationships and governed business measures.
Decide
Deliver insight through Power BI and measurable actions.
Build the Pilot in Six Deliberate Steps
Step 1: Choose One Business Question
Do not start with “move our data into Fabric”. That is a technology activity rather than a business outcome.
Start with a question such as:
- Which customers are becoming less profitable?
- Where is operational demand exceeding forecast?
- Which products are tying up stock without generating enough revenue?
- Which sites are repeatedly missing workforce targets?
Step 2: Map the Data Required to Answer It
List only the data needed for the pilot. For each source, document:
- System or file name
- Business owner
- Technical owner
- Refresh frequency
- Primary key
- Expected record volume
- Known quality problems
- Sensitivity or access requirements
Source: ERP Sales
Owner: Finance
Refresh: Daily
Key: InvoiceID
Required fields:
- CustomerID
- InvoiceDate
- ProductID
- Quantity
- NetSales
- CostValue
Step 3: Create a Repeatable Ingestion Process
The pilot should eliminate the manual export wherever a reliable automated connection is appropriate.
Conceptually:
Source Systems
    ↓
Ingestion / Pipeline
    ↓
Raw Analytical Storage
    ↓
Validation
    ↓
Curated Transformation
Preserve enough source context to diagnose problems later. Useful ingestion metadata can include:
- Source system
- Load timestamp
- Batch or run identifier
- Source filename where relevant
- Record ingestion status
Step 4: Separate Raw Data from Business-Ready Data
Do not make every report clean raw source data independently. Create reusable curated structures.
A simple analytical pattern could be:
Raw
    Source-aligned records

Curated
    Cleaned and standardised data

Business
    Reusable facts, dimensions and KPIs
Typical transformation work includes:
- Standardising dates and identifiers
- Removing invalid records
- Resolving duplicate keys
- Mapping business categories
- Creating reusable dimensions
- Applying approved calculation logic
Step 5: Build a Governed Semantic Model
The semantic model is where the business experience should become much simpler than the underlying data platform.
Create:
- Clear fact and dimension relationships
- Friendly business names
- Reusable DAX measures
- Hidden technical fields where appropriate
- Consistent formats
- Security rules where required
Example measures:
Revenue =
SUM ( FactSales[NetSales] )

Cost =
SUM ( FactSales[CostValue] )

Gross Profit =
[Revenue] - [Cost]

Gross Margin % =
DIVIDE (
    [Gross Profit],
    [Revenue]
)
Step 6: Deliver the Decision, Then Measure the Pilot
Finish the analytical journey with a report designed around the business question selected in Step 1.
Then evaluate more than whether the dashboard looks good. Measure:
- Manual preparation removed
- Refresh reliability
- Data-quality issues discovered
- Report adoption
- Time to answer the target business question
- Number of duplicated calculations retired
- Support effort required
Is Your Use Case Ready for a Fabric Pilot?
Select the statements that apply to your proposed use case. This is an illustrative diagnostic rather than a formal Microsoft Fabric assessment.
Pilot Foundations
Strong pilots begin with a business problem and known ownership, not just access to a technology platform.
Illustrative Fabric Readiness
Your score is based only on the statements selected on this page.
Select the foundations that are already in place.
A Unified Platform Is Only Valuable If People Can Trust It
Fabric can simplify technical architecture, but trust still depends on clear ownership, security, quality and operating controls.
Ownership
Define who owns the source data, analytical product, semantic definitions and final report.
Security
Design access around actual business roles and sensitive information rather than granting broad access for convenience.
Data Quality
Define measurable quality tests for important identifiers, dates, categories and business-critical values.
Operating Model
Decide who monitors pipelines, approves changes, supports failures and manages the analytical solution after launch.
Microsoft Fabric FAQs
What is Microsoft Fabric used for?
Does Microsoft Fabric replace Power BI?
Should we move every data source into Fabric?
Is Fabric only useful for very large businesses?
Can Fabric use data currently stored in Excel?
Do we still need a data warehouse?
How should we estimate Microsoft Fabric cost?
How can Smart Statistics help?
Do Not Start Your Fabric Journey by Moving Everything. Start by Proving One Better Decision.
A focused pilot can show whether an integrated analytical platform actually reduces manual preparation, improves reuse, strengthens governance and helps people reach trusted answers faster.
Smart Statistics helps UK businesses design practical Microsoft Fabric and Power BI solutions around real operational and management decisions — not technology for technology's sake.