

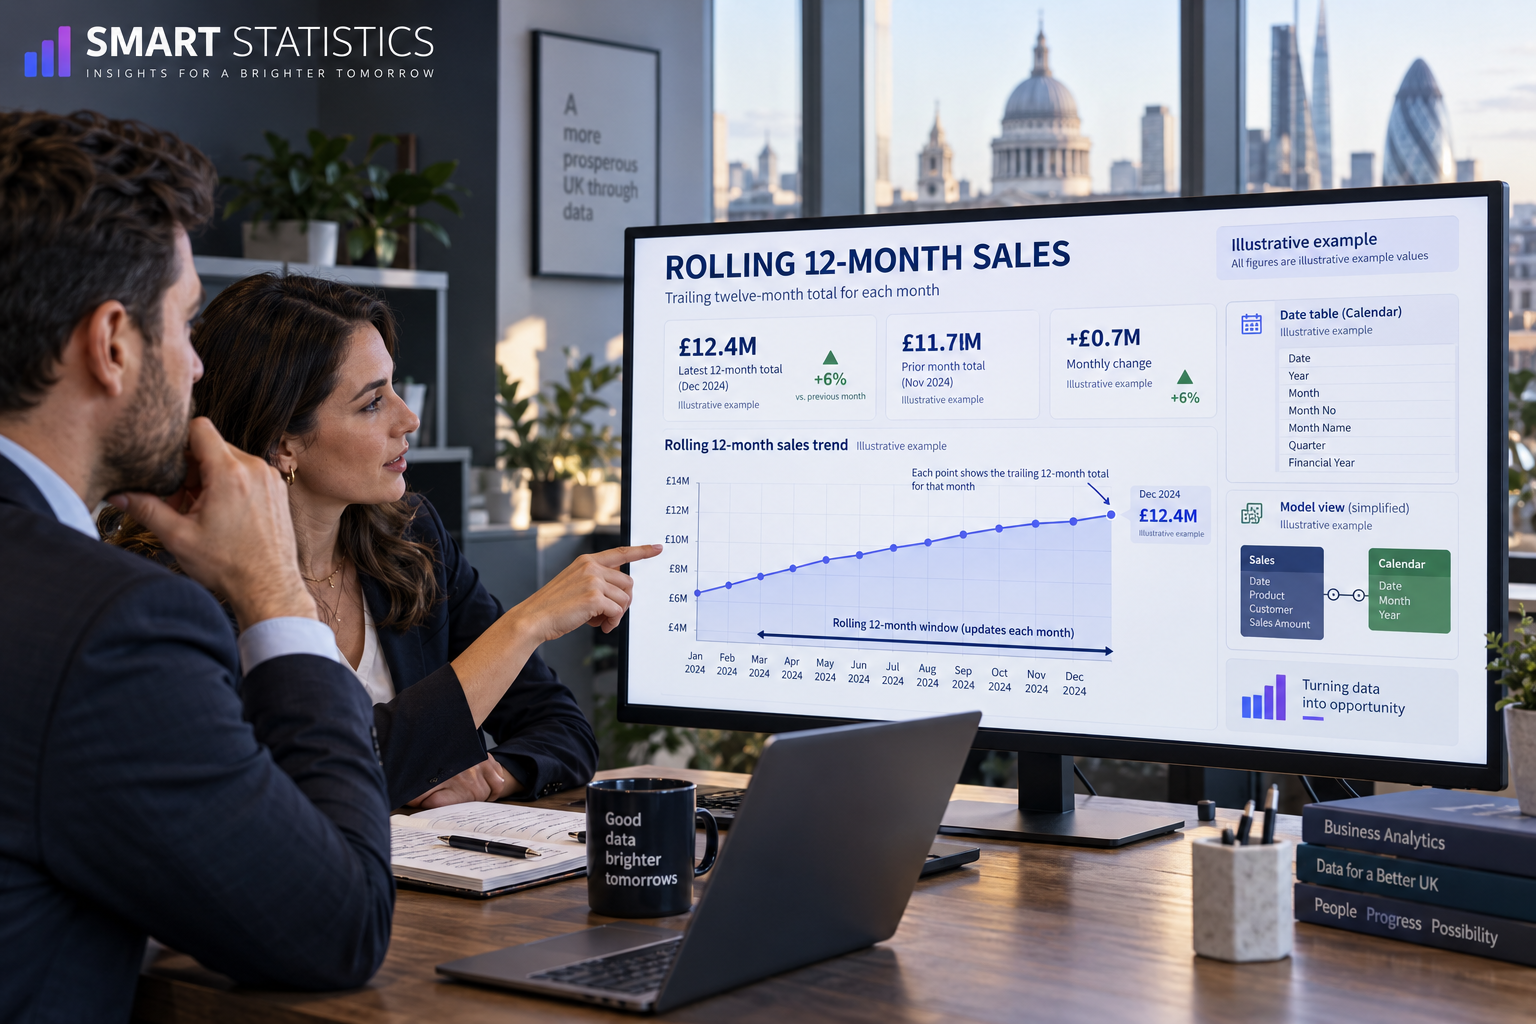
Make every month show its own rolling 12-month sales
Build a proper calendar model and reusable DAX measure so July, August and September each calculate their own trailing twelve-month window—without hard-coded dates.
Example values and trend only—not measured customer performance.
The line chart is not a repeated KPI card
A latest-period card answers “what is the rolling total now?”. A monthly trend must answer the same question separately at every point on the axis. The measure therefore needs to take its end date from the current month’s filter context—not from a fixed date or the global maximum transaction date.
Fix the model before debugging the chart
Most incorrect rolling totals come from one of three structural problems.
No continuous calendar
Using the transaction date directly leaves gaps and makes time-intelligence behaviour dependent on which dates happened to contain sales.
A fixed end date
A hard-coded September endpoint returns one correct number but cannot recalculate for July, August and future months on the same visual.
The wrong axis field
A text month from the fact table may sort alphabetically, mix years or fail to filter the calendar that controls the measure.
A reusable pattern in six practical steps
The examples use a transaction table named DB with Date, Category and Value columns. Rename them to match your model.
Create a complete calendar table
In Power BI Desktop, select New table and create a calendar that covers complete years around the fact data.
Calendar =
VAR FirstFactDate =
    MIN ( 'DB'[Date] )
VAR LastFactDate =
    MAX ( 'DB'[Date] )
RETURN
    ADDCOLUMNS (
        CALENDAR (
            DATE ( YEAR ( FirstFactDate ), 1, 1 ),
            DATE ( YEAR ( LastFactDate ), 12, 31 )
        ),
        "Year", YEAR ( [Date] ),
        "Month Number", MONTH ( [Date] ),
        "Month", FORMAT ( [Date], "mmm" ),
        "Year Month", FORMAT ( [Date], "mmm yyyy" ),
        "Year Month Sort", YEAR ( [Date] ) * 100 + MONTH ( [Date] )
    )
Set Calendar[Date] to the Date data type. For classic time-intelligence functions, mark the table as the model’s date table. Microsoft’s date-table guidance requires unique, non-blank and contiguous dates spanning full years.
Calendar[Year Month], choose Sort by column, then select Calendar[Year Month Sort]. This prevents alphabetical month order.Create the active one-to-many date relationship
Relate Calendar[Date] on the one side to DB[Date] on the many side. Use single-direction filtering from Calendar to DB and make this the active relationship for sales reporting.
DB[Date] contains timestamps, create or transform a date-only column before relating it to the calendar. A value such as 21/09/2026 14:30 does not equal 21/09/2026 00:00.Create one base sales measure
Keep the business definition separate from the rolling-window calculation. This version deliberately fixes Category to Sales while preserving filters such as customer, site, product or region.
Sales Amount =
CALCULATE (
    SUM ( 'DB'[Value] ),
    'DB'[Category] = "Sales"
)
Format the measure as GBP currency. If the table already contains only sales rows, use SUM ( 'DB'[Value] ) instead.
Calculate twelve full calendar months for every point
The current point on the visual supplies MAX(Calendar[Date]). The formula aligns that date to month-end, goes back twelve month-ends, adds one day and evaluates the base measure inside that inclusive range.
Rolling 12-Month Sales =
VAR CurrentMonthEnd =
    EOMONTH (
        MAX ( 'Calendar'[Date] ),
        0
    )
VAR WindowStart =
    EOMONTH (
        CurrentMonthEnd,
        -12
    ) + 1
VAR LastFactDate =
    CALCULATE (
        MAX ( 'DB'[Date] ),
        REMOVEFILTERS ( 'Calendar' ),
        'DB'[Category] = "Sales"
    )
RETURN
    IF (
        CurrentMonthEnd >
            EOMONTH ( LastFactDate, 0 ),
        BLANK (),
        CALCULATE (
            [Sales Amount],
            DATESBETWEEN (
                'Calendar'[Date],
                WindowStart,
                CurrentMonthEnd
            )
        )
    )
For September 2026, this produces a window from 1 October 2025 through 30 September 2026. For August 2026, the same measure automatically shifts to 1 September 2025 through 31 August 2026.
Add a completed-month KPI when the current month is partial
A monthly trend can show the current month as it develops, but a board KPI may require twelve completed months. Use an approved reporting cut-off rather than guessing from transaction activity. This example uses the end of the previous calendar month.
Rolling 12 Sales - Last Complete Month =
VAR ReportingEnd =
    EOMONTH ( TODAY (), -1 )
VAR ReportingStart =
    EOMONTH ( ReportingEnd, -12 ) + 1
RETURN
    CALCULATE (
        [Sales Amount],
        REMOVEFILTERS ( 'Calendar' ),
        DATESBETWEEN (
            'Calendar'[Date],
            ReportingStart,
            ReportingEnd
        )
)TODAY() with a controlled “latest closed period” date maintained by the process owner. That keeps the KPI aligned with period closure and refresh timing.Build the chart and monthly comparison
Create a line chart with Calendar[Year Month] on the X-axis and [Rolling 12-Month Sales] as the value. Do not use the automatic date hierarchy or a month label from DB.
Rolling 12 Sales - Previous Month =
CALCULATE (
    [Rolling 12-Month Sales],
    DATEADD (
        'Calendar'[Date],
        -1,
        MONTH
    )
)

Rolling 12 Sales Change =
[Rolling 12-Month Sales]
    - [Rolling 12 Sales - Previous Month]

Rolling 12 Sales Change % =
DIVIDE (
    [Rolling 12 Sales Change],
    [Rolling 12 Sales - Previous Month]
)
Use the current and previous rolling measures in tooltips or cards. Format the percentage measure as a percentage and make sure comparison labels say “versus previous reporting month”, not “versus previous year”.
Prove the window with dates and reconciliation
A plausible line is not evidence of correctness. Test the boundaries and compare selected months with an independent calculation.
| Test | Expected result | Evidence |
|---|---|---|
| September 2026 point | 1 October 2025 to 30 September 2026 | Daily transaction extract or finance total |
| August 2026 point | 1 September 2025 to 31 August 2026 | Independent grouped calculation |
| Customer filter | Window stays the same; amount reflects the customer | Filtered transaction list |
| No-sales month | The window moves even when that month contributes zero | Calendar still contains every date |
| Future month | Blank after the latest fact month | Visual does not project historical totals forward |
| Partial current month | Clearly labelled as partial or replaced by completed-month KPI | Reporting policy and cut-off date |
Keep the measure trusted after publication
Time intelligence stays reliable when its calendar, business definition and period status have clear ownership.
Own the definition
Name the business owner for “Sales”, including returns, tax, currency, cancellations and internal transactions.
Control closure
Publish the latest closed period and make partial-month treatment explicit across cards and charts.
Reuse the model
Store the approved measure in a governed semantic model instead of copying variations into reports.
Retain tests
Reconcile boundary months after model, source, accounting-policy or calendar changes.
Is your rolling trend ready for business use?
Select each statement supported by current evidence. This illustrative checklist is not a financial audit.
Questions that prevent misleading totals
Why does every month show the same rolling value?
The measure is probably using a fixed endpoint or removing the month context that should define each point. Use the maximum calendar date in the current visual context as the rolling endpoint.
Why does the KPI card differ from the line chart?
A card has no individual month on its axis, so its date context can differ from the chart. Decide whether the card should show the latest available month, the latest completed month or the user-selected month, then encode and label that rule explicitly.
Should the window contain the current partial month?
Only if the report clearly presents an in-progress result. For closed-period reporting, use an approved latest-closed-month date and end the twelve-month window there.
Can I use the transaction date directly on the chart?
It is safer to use a dedicated calendar. A proper date table provides every date, consistent month labels and the filter context required by reusable time-intelligence measures.
Why do my months appear in alphabetical order?
A text month or year-month label needs a numeric sort column. Sort Year Month by a value such as 202609 so chronology is preserved across years.
Does the formula respect customer, product and site filters?
Yes, provided those filters propagate correctly through the model. The date-range calculation changes the calendar filter while the base measure continues to respect other valid filter context.
Turn a fragile rolling total into a measure your business can trust
Smart Statistics helps UK businesses design reliable Power BI models, DAX measures, reporting controls and decision-ready dashboards. Start with the measures that appear in senior reviews and make their period logic explicit.
Technical references
Microsoft documentation checked on 21 September 2026. The model names, figures, reporting scenarios, tests and governance recommendations are illustrative Smart Statistics guidance.