

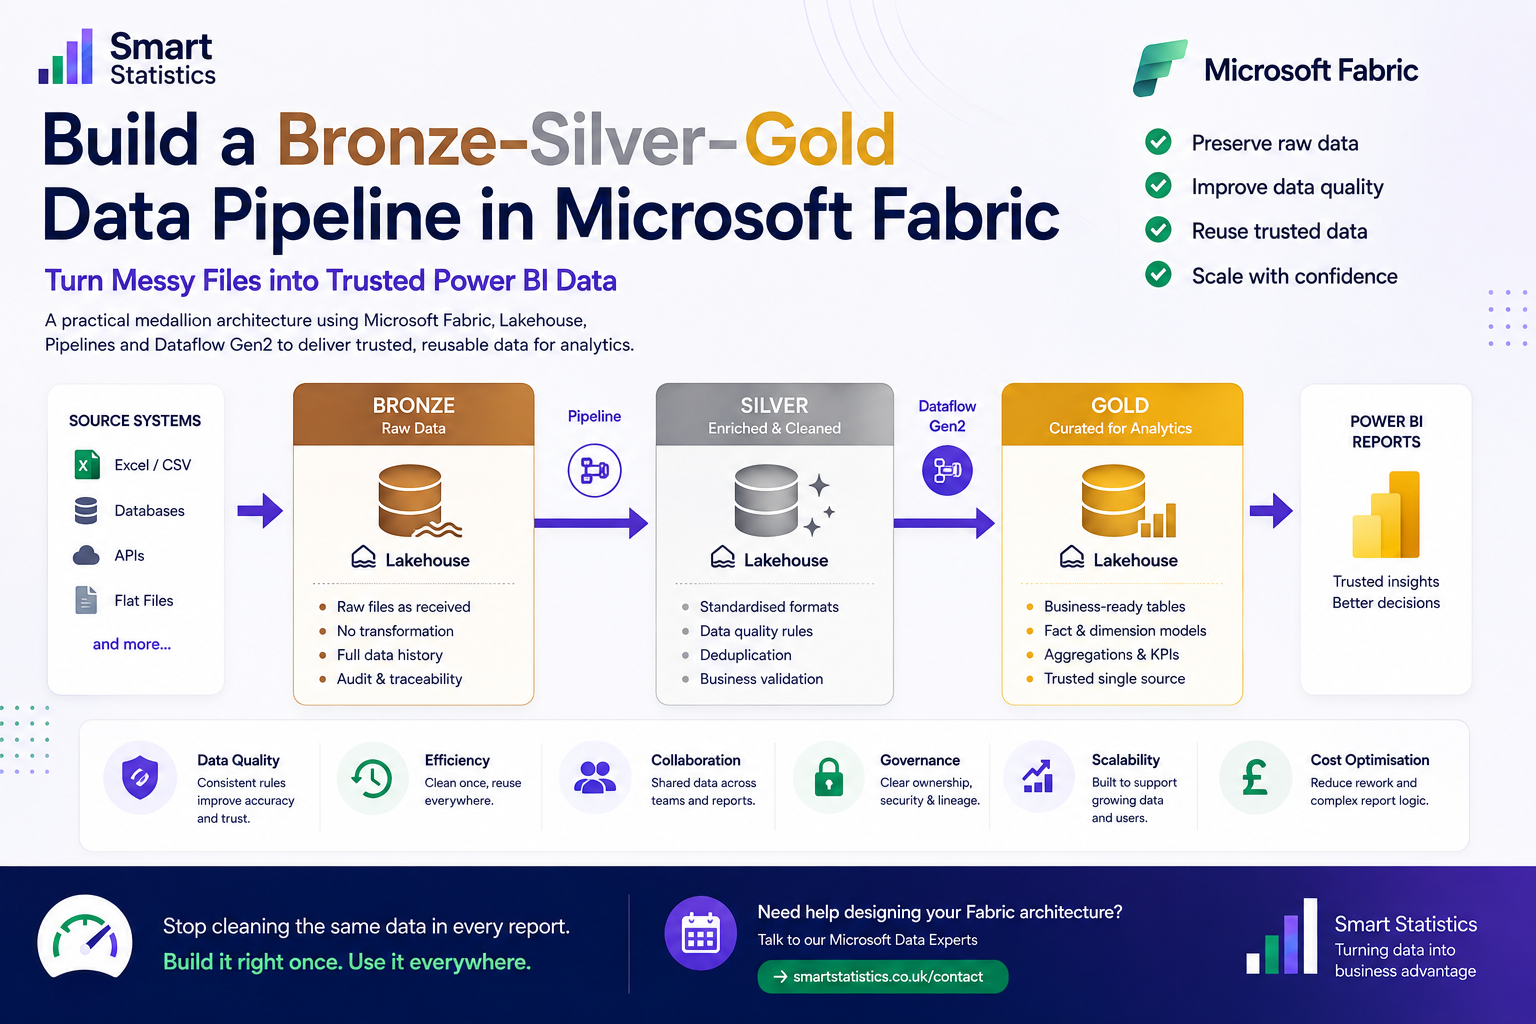
Build a Bronze–Silver–Gold Data Pipeline in Microsoft Fabric
Many reporting problems begin long before Power BI opens. Data arrives from CSV files, Excel workbooks, operational databases and exported reports with inconsistent structures, duplicate records and different levels of quality.
A medallion architecture gives that data a controlled journey. Raw data lands in Bronze, validated and standardised data moves into Silver, and trusted reporting data is published into Gold.
The result is a reporting architecture where Power BI does not need to repeatedly clean the same raw data inside every individual report.
Each Layer Has a Different Job
The medallion pattern prevents raw ingestion, data cleansing and reporting logic from becoming one large process that is difficult to test and support.
Bronze — Raw
Bronze is the landing zone. Preserve the source representation so you retain a recoverable history of what arrived.
- CSV and JSON files
- Database extracts
- API payloads
- Source snapshots
Silver — Enriched
Silver is where inconsistent raw data becomes reliable enough to reuse across analytical workloads.
- Correct data types
- Standardised codes
- Duplicate removal
- Quality validation
Gold — Curated
Gold is built around analytical consumption rather than source-system structure.
- Fact tables
- Dimensions
- Business summaries
- KPI-ready datasets
From Three Source Files to One Trusted Sales Model
Imagine a UK wholesaler receiving three daily extracts from different operational systems.
| Source | Typical Problem | Gold-Layer Outcome |
|---|---|---|
| Sales.csv | Dates arrive as text, customer codes contain spaces and duplicate transaction rows can appear. | Clean fact table with one validated transaction grain and calculated sales value. |
| Customers.csv | Missing regions, inconsistent customer names and duplicated customer references. | Curated Customer dimension with standardised regional attributes. |
| Products.csv | Category names vary and obsolete products remain mixed with active items. | Product dimension with controlled categories and reporting attributes. |
Keep the Processing Sequence Explicit
1. Source
CSV, Excel, SQL, APIs or other operational sources.
2. Bronze
Land the data without business transformation.
3. Silver
Standardise, validate and enrich the data.
4. Gold
Publish curated business-ready tables.
5. Power BI
Build semantic models and reports from trusted data.
Build the Medallion Architecture in Seven Steps
Define the reporting outcome first
Before creating Lakehouses or pipelines, define what the Gold layer must eventually support.
In this example, management needs:
- Total Revenue
- Gross Profit
- Revenue by Customer
- Revenue by Product Category
- Revenue by Region
- Monthly trend
That tells us the Gold layer requires at least:
- FactSales
- DimCustomer
- DimProduct
- DimDate
Create the three Fabric data layers
Create separate governed areas for the three processing stages.
A simple naming pattern is:
lh_sales_bronze
lh_sales_silver
lh_sales_gold
The exact design can vary. Some organisations separate layers into different Lakehouses, while others structure them according to broader domain and governance requirements.
Land source data into Bronze
Create a Fabric Pipeline and add Copy Data activities for each source.
For the example business:
- Copy Sales.csv into Bronze
- Copy Customers.csv into Bronze
- Copy Products.csv into Bronze
Keep the Bronze copy close to the original representation.
A useful folder pattern is:
Files/
    sales/
        2026/
            08/
                29/
                    Sales.csv

    customers/
        2026/
            08/
                29/
                    Customers.csv

    products/
        2026/
            08/
                29/
                    Products.csv
A dated landing structure provides a clear record of what arrived on each processing date.
Clean the data into Silver with Dataflow Gen2
Create a Dataflow Gen2 that reads the Bronze data and applies reusable transformation rules.
For Sales:
- Set the correct data types
- Trim customer and product codes
- Remove invalid blank transaction IDs
- Remove duplicate transactions
- Reject or flag invalid quantities
Example Power Query M:
let
    Source = BronzeSales,

    ChangedTypes =
        Table.TransformColumnTypes(
            Source,
            {
                {"TransactionID", type text},
                {"SaleDate", type date},
                {"CustomerID", type text},
                {"ProductID", type text},
                {"Quantity", Int64.Type},
                {"UnitPrice", Currency.Type}
            }
        ),

    CleanCodes =
        Table.TransformColumns(
            ChangedTypes,
            {
                {
                    "CustomerID",
                    each Text.Upper(Text.Trim(_)),
                    type text
                },
                {
                    "ProductID",
                    each Text.Upper(Text.Trim(_)),
                    type text
                }
            }
        ),

    ValidRows =
        Table.SelectRows(
            CleanCodes,
            each
                [TransactionID] <> null
                and [Quantity] > 0
        ),

    Deduplicated =
        Table.Distinct(
            ValidRows,
            {"TransactionID"}
        )

in
    Deduplicated
Send the result to a Silver Lakehouse table such as:
SilverSales
Build business-ready Gold tables
Gold should organise the data around how the business analyses it.
For the sales fact table, add a reusable sales value:
let
    Source = SilverSales,

    AddedSalesValue =
        Table.AddColumn(
            Source,
            "SalesValue",
            each [Quantity] * [UnitPrice],
            Currency.Type
        )

in
    AddedSalesValue
Publish the result as:
FactSales
Build separate curated dimensions:
DimCustomer
DimProduct
DimDate
Gold is also the appropriate place for curated summary tables where there is a genuine analytical requirement.
Orchestrate Bronze → Silver → Gold
Return to the Fabric Pipeline and create an explicit dependency chain.
Conceptually:
Copy Source Data
        ↓
Bronze Load Complete
        ↓
Run Silver Dataflow
        ↓
Silver Validation Complete
        ↓
Run Gold Dataflow
        ↓
Gold Tables Ready
        ↓
Reporting Process
Configure downstream activities to run only after the previous critical activity succeeds.
This prevents Gold from being rebuilt from incomplete Silver data.
Build Power BI from Gold — not Bronze
Your Power BI reporting layer should normally consume the curated structures designed for analytics rather than directly connecting every report to raw operational extracts.
Build relationships around:
- FactSales
- DimCustomer
- DimProduct
- DimDate
Then create measures such as:
Total Revenue =
SUM(
    FactSales[SalesValue]
)

Total Quantity =
SUM(
    FactSales[Quantity]
)

Average Selling Price =
DIVIDE(
    [Total Revenue],
    [Total Quantity]
)
The important difference is architectural: Power BI is now responsible primarily for semantic modelling and analysis rather than repeatedly cleaning source files.
A Medallion Architecture Needs Ownership as Well as Technology
Three layers do not automatically create trustworthy data. The processing rules and ownership around them still matter.
Named Owners
Assign responsibility for source systems, transformation rules and Gold business definitions.
Data Quality Rules
Define what causes a record to be accepted, corrected, quarantined or rejected.
Pipeline Monitoring
Monitor failed or unusually long pipeline runs rather than assuming scheduled processing succeeded.
Document the Gold Layer
Record grain, business meaning, refresh timing and ownership for important curated tables.
Microsoft Fabric Medallion FAQs
What is Bronze, Silver and Gold in Microsoft Fabric?
Do I need three separate Lakehouses?
Can Dataflow Gen2 write to a Lakehouse?
Can a Fabric Pipeline run Dataflow Gen2?
Should Power BI connect directly to Bronze?
Is medallion architecture only for very large companies?
Can I use SQL or notebooks instead of Dataflow Gen2?
How can Smart Statistics help?
Is Your Power BI Team Still Cleaning the Same Raw Data in Every Report?
Smart Statistics helps UK businesses move data preparation upstream into structured Microsoft Fabric architectures so reporting teams can work from trusted, reusable data.
We can help with Fabric Lakehouse design, Pipelines, Dataflow Gen2, Power BI semantic models, data quality and wider analytics architecture.