

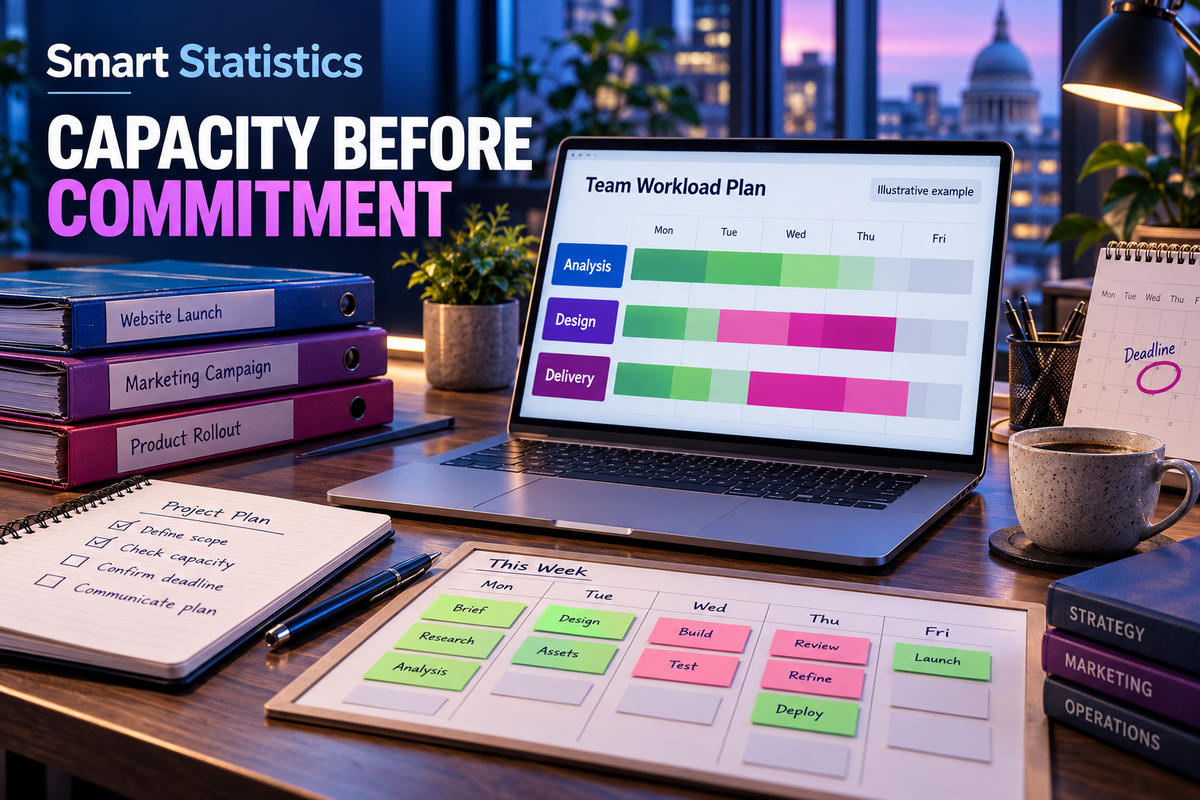
Check the workload before you promise the deadline
Build a weekly Excel capacity planner that shows whether the right team has enough hours for the work you have accepted.
Available hours, committed work and one clear decision: accept, move, reduce or resource the request.
8 October 2026 · Microsoft Excel · For UK operations and project teams
Spare hours. Wrong team.
Decision needed: Design is over capacity despite 8 hours of aggregate headroom.
A free hour is only useful if it can do the work
A project lead sees eight spare hours across the department and accepts another brief. The designer sees an already full week. Both are looking at the same plan, but only one is looking at the constraint.
This Excel capacity planning tutorial builds a small weekly decision tool. It separates scheduled hours from hours available for planned work, and accepted work from proposals. It does not assume that a spare analyst can replace a designer or that a weekly total proves a Tuesday deadline is achievable.
Use this when: one owner can maintain a modest team plan and commitments are discussed weekly. Use more detailed scheduling when individual skills, shifts, dependencies or concurrent edits make a team-week view insufficient.
Keep three planning decisions separate
What is available?
Subtract absence and fixed commitments from scheduled hours. Agree where meetings, training and routine support are counted so they are deducted once.
What is promised?
Count only committed work in the baseline. Keep proposed work visible without quietly treating it as an accepted delivery promise.
What can change?
Choose an explicit response to a shortage: change the date, reduce scope, move suitable work or secure authorised capacity. Record who agrees.
Build the weekly planner
Use a blank workbook in Excel for Microsoft 365. No macros or Power Query are required.
Create four sheets and one week selector
Name the sheets Setup,
Availability, Workload
and Plan. On Setup, enter
=DATE(2026,10,12) in B2 and format it as
dd mmm yyyy. This Monday is the selected
WeekStart.
Use real Excel dates with no time component. Every WeekStart must be a Monday. Hours are decimal numbers: 7.5 means seven and a half hours, not an Excel time value. Keep the same team names everywhere: Analysis, Design and Delivery.
Create the capacity table
On Availability, enter the sample below. Select it, choose
Insert → Table, confirm headers, then set
the table name to tblCapacity. Add the
calculated columns NetHours and
InputCheck. There must be exactly one row per
team and week.
| WeekStart | Team | ScheduledHours | AbsenceHours | FixedHours |
|---|---|---|---|---|
| 12 Oct 2026 | Analysis | 100 | 8 | 12 |
| 12 Oct 2026 | Design | 80 | 8 | 8 |
| 12 Oct 2026 | Delivery | 70 | 7 | 7 |
In the first data cell of NetHours, enter:
=[@ScheduledHours]-[@AbsenceHours]-[@FixedHours]In InputCheck, enter the following. A blank or text hour value must be investigated, not silently interpreted as zero.
=IF(COUNT([@[ScheduledHours]:[FixedHours]])<>3,"CHECK",
 IF(OR([@ScheduledHours]<0,[@AbsenceHours]<0,
 [@FixedHours]<0,[@NetHours]<0),"CHECK","OK"))
Excel tables support calculated columns and structured references. Confirm both formulas fill down. Keep negative capacity visible for correction; do not hide an invalid deduction with a zero floor.
Record work against the week it will consume
On Workload, create a table named tblWork
using the columns below. Each row is one allocation, with
a unique AllocationID. If a task spans two weeks, split its
hours into two allocations; do not repeat the full estimate
in each week.
| AllocationID | WeekStart | Team | WorkItem | Hours | Status |
|---|---|---|---|---|---|
| W01 | 12 Oct 2026 | Analysis | Requirements | 40 | Committed |
| W02 | 12 Oct 2026 | Analysis | Data mapping | 28 | Committed |
| W03 | 12 Oct 2026 | Design | Prototype | 48 | Committed |
| W04 | 12 Oct 2026 | Design | Revisions | 30 | Committed |
| W05 | 12 Oct 2026 | Delivery | Release preparation | 30 | Committed |
| W06 | 12 Oct 2026 | Delivery | Handover | 16 | Committed |
| W07 | 12 Oct 2026 | Design | New brief | 12 | Proposed |
For a future week, use the hours expected in that week. When replanning a week already under way, compare remaining work with remaining capacity; do not mix remaining work with a full week's supply. Capture an owner and due date alongside each real allocation.
Build the Plan summary
On Plan, use these headers in A1:G1: Team, Capacity, Committed, Headroom, Shortfall, Load, Status . Put Analysis, Design and Delivery in A2:A4. This summary is an ordinary range. Enter each formula below in its stated cell, then copy down to row 4.
B2 · net available hours
=SUMIFS(tblCapacity[NetHours],
 tblCapacity[WeekStart],Setup!$B$2,tblCapacity[Team],$A2)
C2 · accepted work only
=SUMIFS(tblWork[Hours],tblWork[WeekStart],Setup!$B$2,
 tblWork[Team],$A2,tblWork[Status],"Committed")
D2 · headroom; E2 · shortage; F2 · loading
D2: =B2-C2
E2: =MAX(0,C2-B2)
F2: =IF(B2>0,C2/B2,"")
Enter only the expression after each cell label. Format F2:F4 as percentages. A blank load with zero capacity is deliberate; the status still exposes work that has no capacity.
G2 · a visible source check before the capacity verdict
=IF(OR(
 COUNTIFS(tblCapacity[WeekStart],Setup!$B$2,
 tblCapacity[Team],$A2)<>1,
 COUNTIFS(tblCapacity[WeekStart],Setup!$B$2,
 tblCapacity[Team],$A2,tblCapacity[InputCheck],"<>OK")>0),
 "CHECK SOURCE",IF(D2<0,"OVER CAPACITY","WITHIN HOURS"))
Do not use totals for a decision while any source check fails. These checks catch missing or duplicate capacity rows and invalid capacity inputs. They do not validate every workload record; complete the checks in the next step.
For totals, use =SUM(B2:B4) through column E.
Overall load is
=IF(SUM(B2:B4)>0,SUM(C2:C4)/SUM(B2:B4),""),
not the average of the team percentages. Formulas use
English names and comma separators; some regional settings
require semicolons.
| Team | Capacity | Committed | Headroom | Shortfall | Load | Status |
|---|---|---|---|---|---|---|
| Analysis | 80 h | 68 h | 12 h | 0 h | 85% | Within hours |
| Design | 64 h | 78 h | −14 h | 14 h | 121.9% | Over capacity |
| Delivery | 56 h | 46 h | 10 h | 0 h | 82.1% | Within hours |
| Total | 200 h | 192 h | 8 h | 14 h | 96% | Review Design |
Stop the easy input mistakes
Use Data → Data Validation to restrict
Team to the maintained team list, Status to
Proposed,Committed,Cancelled, and all hour
inputs to non-negative decimals. Use a Stop error alert.
Review existing and pasted records too: validation is not
a complete barrier to invalid data.
Check for blank fields, text dates, non-Monday weeks, duplicate AllocationIDs and teams missing from the Plan summary. Reconcile committed hours in the source to the summary for the selected week. Flag negative Headroom with a contrasting fill, but retain the written status so colour is never the only signal.
Test deliberately: W07 changed to Committed must produce 90 Design hours and a 26-hour Design shortfall. Moving W07 to the following Monday must remove it from this week's total. Removing or duplicating the Design capacity row must show CHECK SOURCE. Zero Design capacity with committed work must show OVER CAPACITY and a blank Load.
Resolve the shortage with the delivery owner
In the illustrative baseline, Analysis and Delivery have 22 spare hours between them, while Design is short by 14. Transfer work only when the receiving team has suitable skills, availability and authority. Recheck dependencies and the actual due day before promising delivery.
For the proposed 12-hour brief, identify what would move or who would provide the extra design capacity. Record the agreed action, accountable owner and review date. A positive weekly balance is a screening result, not a delivery guarantee.
Try the commitment decision
Illustrative example · add proposed Design work to the baseline.
How many extra Design hours?
Assumes every extra hour is accepted in this week, with no change to capacity, scope or existing work. The control becomes available when JavaScript runs.
Make the planner part of the operating routine
A formula cannot decide who is authorised to change a promise.
Ownership and safeguards
- The team lead confirms capacity, absence totals and realistic estimates.
- The project owner authorises changes to scope, priority and dates.
- The workbook owner maintains team lists, formulas and a dated planning snapshot.
- Keep sensitive absence reasons outside this plan. Share only the hours needed for planning.
Adoption and measurement
- Pilot one team for four weekly planning meetings before expanding.
- Track shortages resolved before commitment, delivery-date changes and emergency overtime.
- Compare estimated with actual effort on completed work to improve future estimates.
- Keep a realistic allowance for unplanned demand. Do not treat 100% loading as a universal target.
The business benefit is an earlier, explicit trade-off. Measure fewer late surprises and less avoidable rework; do not claim savings simply because the workbook shows spare hours.
Is this plan ready to support a commitment?
Tick only controls you can evidence. This assessment is a discussion aid.
Frequently asked questions
Does spare capacity mean we can promise a delivery date?
No. A weekly balance is an initial screen. Check the required skills, daily availability, dependencies and scope before the delivery owner confirms a date.
Should proposed work count as committed demand?
No. Keep proposals separate until authorised. Test them as scenarios, then change their status to Committed only when the delivery decision has been agreed.
How should a task spanning several weeks be recorded?
Allocate only the hours expected in each week, with a unique allocation ID for each row. Do not repeat the full task estimate in every week.
Why can total headroom be positive while a team is overloaded?
Spare hours in one team may not be suitable for another team's work. Show team shortfalls separately and transfer work only after checking skills and availability.
Make the next promise with a clearer plan
Smart Statistics can help turn scattered work estimates and availability into a practical capacity view, with agreed definitions, useful checks and a planning routine your team can maintain.