

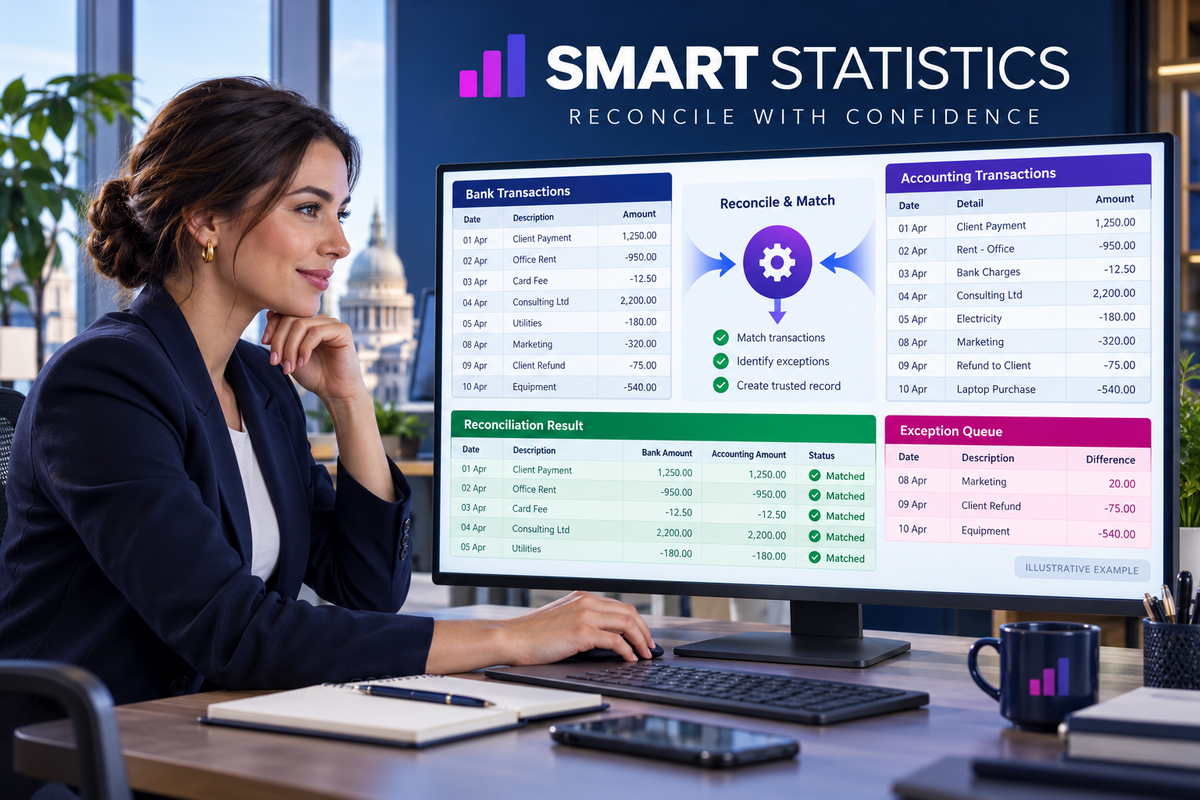
Excel reconciliation tutorial: match two transaction lists and explain every difference
Build a repeatable control that proves which records match, exposes duplicates and missing transactions, and reconciles the remaining value before anybody publishes the result.
29 September 2026 · For UK finance, operations and reporting teams
Transaction reconciliation control
5 rows
match
queue
Control passed: +£420 + £30 − £300 = £150 source difference.
Decision: investigate three exception keys before sign-off.
A lookup is not yet a reconciliation
XLOOKUP can return a value, but the business control is only complete when every source row is accounted for and the unexplained value equals the difference between the two source totals.
First-match risk
A lookup can return the first matching row while a duplicate remains elsewhere. Without a uniqueness test, the workbook may look clean while overstating or understating value.
One-way blind spot
Checking operations against the ledger finds missing ledger entries, but it cannot find a ledger-only transaction. Reconciliation needs a reverse check as well as the forward match.
False zero
Net differences can cancel. A positive missing item and a negative missing item may create a zero total even though both require investigation, ownership and evidence.
Build the test fixture before the real workbook
Start with records where you already know the expected answer. This proves the formulas before you introduce production data.
| Key | Operations amount | Ledger amount | Expected status | Signed exception |
|---|---|---|---|---|
| INV-1001 | £1,250.00 | £1,250.00 | Matched | £0.00 |
| INV-1002 | £740.50 | £740.50 | Matched | £0.00 |
| INV-1003 | £980.00 | £950.00 | Amount difference | +£30.00 |
| INV-1004 | £420.00 | — | Missing in ledger | +£420.00 |
| INV-1005 | £600.00 | £600.00 | Matched | £0.00 |
| INV-1006 | — | £300.00 | Missing in operations | −£300.00 |
| Control totals | £3,990.50 | £3,840.50 | Three exception keys | +£150.00 |
Then deliberately add a duplicate INV-1005 row to one source. The status should change to a duplicate review rather than silently accepting the first value.
Set up two controlled Excel Tables
Create worksheets called Operations, Ledger and Control. Keep source data, formulas and sign-off separate.
Create and name the source Tables
Paste each source into its own sheet, select a cell and use Insert > Table. Confirm headers, then name the Tables tblOps and tblLedger in Table Design.
Use an immutable business reference where possible. Do not match on row number, description alone or a displayed date format.
Add a normalised Match Key
Normalise case, ordinary spaces, non-breaking spaces and non-printing characters. The calculated column fills through the Table and expands with new rows.
=UPPER(TRIM(CLEAN(SUBSTITUTE([@[Invoice Number]],CHAR(160)," "))))In tblLedger, replace Invoice Number with the ledger column name, such as Reference.
Prove uniqueness before using XLOOKUP
Count the key in both Tables first. Only retrieve an amount when the target source contains exactly one matching key.
Count each key in both directions
Add Ops Key Count and Ledger Key Count columns to tblOps.
=COUNTIF(tblOps[Match Key],[@[Match Key]])

=COUNTIF(tblLedger[Match Key],[@[Match Key]])
A count of zero means missing; one means unique; more than one means the key needs duplicate review before a value can be trusted.
Retrieve only a unique ledger amount
Add Ledger Amount to tblOps. The exact-match argument is explicit, while the outer IF blocks missing or duplicate targets.
=IF(
  [@[Ledger Key Count]]=1,
  XLOOKUP(
    [@[Match Key]],
    tblLedger[Match Key],
    tblLedger[Ledger Amount],
    "",
    0
  ),
  ""
)
Microsoft documents that XLOOKUP returns an exact match by default; this tutorial still supplies 0 for match mode to make the control intention visible. XLOOKUP is not available for authoring in Excel 2016 or Excel 2019, so confirm the workbook’s supported version before rollout.
Classify the exception instead of hiding the error
A usable reconciliation gives each row one clear status and preserves the evidence needed to resolve it.
Calculate variance and status
Round currency differences to two decimal places for the control. Keep the tolerance in a named cell if the business permits anything other than a penny.
=IF(
  AND([@[Ops Key Count]]=1,[@[Ledger Key Count]]=1),
  ROUND([@[Operations Amount]]-[@[Ledger Amount]],2),
  ""
)
=IFS(
[@[Ops Key Count]]>1,"Review duplicate in operations",
[@[Ledger Key Count]]=0,"Missing in ledger",
[@[Ledger Key Count]]>1,"Review duplicate in ledger",
ABS([@Variance])<=0.01,"Matched",
TRUE,"Amount difference"
)Run the reverse ledger check
In tblLedger, calculate the ledger key count and operations key count, then classify the reverse result.
=COUNTIF(tblLedger[Match Key],[@[Match Key]])

=COUNTIF(tblOps[Match Key],[@[Match Key]])
=IFS(
[@[Ledger Key Count]]>1,"Review duplicate in ledger",
[@[Ops Key Count]]=0,"Missing in operations",
[@[Ops Key Count]]>1,"Review duplicate in operations",
TRUE,"Accounted for"
)Make the exception bridge equal the source difference
The Control sheet should prove the arithmetic independently of the row labels.
Calculate source totals and counts
Operations total
=SUM(tblOps[Operations Amount])

Ledger total
=SUM(tblLedger[Ledger Amount])

Source difference
=ROUND(
  SUM(tblOps[Operations Amount])-
  SUM(tblLedger[Ledger Amount]),
  2
)

Matched operations rows
=COUNTIF(tblOps[Status],"Matched")Build the signed exception bridge
=SUMIFS(
  tblOps[Variance],
  tblOps[Status],"Amount difference"
)
+SUMIFS(
  tblOps[Operations Amount],
  tblOps[Status],"Missing in ledger"
)
-SUMIFS(
  tblLedger[Ledger Amount],
  tblLedger[Status],"Missing in operations"
)
The bridge must equal the source difference. If it does not, the exception logic is incomplete, a duplicate is unresolved, or a source amount is not being counted consistently.
Best practices for a reconciliation people can trust
Good formulas are only one layer. Ownership, evidence and repeatability turn the workbook into a business control.
Separate preparation from approval
Name a preparer, reviewer and business owner. The preparer refreshes and investigates; the reviewer challenges totals and exceptions; the owner approves material judgements and tolerance.
Preserve source evidence
Record source system, extraction time, reporting period, row count and total. Keep the original extracts read-only, restrict sensitive data and follow the organisation’s retention policy.
Design for reruns
Document the key, signs, currency, tolerance and treatment of reversals. If the same manual clean-up returns every month, fix the upstream process or move the repeatable transformation into a governed pipeline.
Excel Tables use structured references that adjust as rows are added or removed, and calculated columns can apply one formula consistently through a Table. These behaviours support repeatability but do not replace review, access control or source-system ownership.
Choose the right matching rule
The simplest rule that accurately reflects the business process is usually the most supportable.
| Situation | Recommended rule | Control concern |
|---|---|---|
| Stable unique transaction reference | Exact key match plus duplicate counts. | Confirm uniqueness in both sources before retrieving value. |
| Reference differs only by spacing or case | Normalise a derived Match Key; retain the originals. | Do not overwrite evidence or mask genuinely different identifiers. |
| One business event creates several ledger lines | Aggregate to the agreed grain before matching. | Document grouping fields and prove aggregated totals back to detail. |
| Dates can legitimately shift | Match stable key first; test the date separately as an attribute. | A fuzzy date rule can connect unrelated records. |
| No trustworthy key exists | Use an approved composite key or controlled manual review. | Measure collision rate and avoid presenting probabilistic matches as facts. |
| High volume or business-critical process | Move towards Power Query, SQL or a governed data platform. | Retain the same two-way checks, totals, ownership and exception evidence. |
Adopt the control without creating another spreadsheet dependency
Run one controlled period, compare the result with the existing process, and only then make it operational.
Pilot with known exceptions
Test clean matches, missing records, duplicates, amount differences, blank keys, reversals and leading zeros. Record expected and actual results so future changes can be regression-tested.
Train for investigation
Users need more than formula instructions. Show how to find source evidence, assign exception ownership, distinguish timing from error, document resolution and rerun the control.
Set a migration trigger
Define when Excel is no longer enough: volume, refresh frequency, multiple preparers, sensitive data, long runtimes, repeated copy-and-paste, or a need for automated monitoring and audit history.
Measure control quality and business impact
Do not claim value from a prettier workbook. Measure whether the process becomes faster, clearer and more reliable.
Control measures
Track unmatched row count and value, duplicate keys, aged exceptions, reopened exceptions, bridge-to-source difference, late sign-offs and percentage of exceptions with evidence.
Monitor by source and root cause so recurring defects are assigned upstream rather than repeatedly corrected in Excel.
Business measures
Compare preparation time, review time, time to close, manual adjustments, report delays and post-publication corrections before and after implementation.
Separate cash impact from capacity released. A time saving becomes financial value only when the organisation can evidence how that capacity is used.
Is your reconciliation ready for user acceptance?
Select only controls you have tested with evidence. The assessment updates locally in the browser and submits nothing.
Frequently asked questions
Why not use XLOOKUP on its own?
XLOOKUP can return the first matching item, but it does not prove that the lookup key is unique or that the other source contains no extra records. Count keys first and perform a reverse check.
What tolerance should I use for amount differences?
Use the smallest tolerance justified by the business process, currency and accounting policy. Record it in one controlled cell, approve it and report differences hidden by that tolerance where material.
How should I handle one-to-many transactions?
Agree the reconciliation grain, aggregate the many-side data to that grain and prove the aggregate back to its detail. Do not force a one-to-one lookup onto a one-to-many process.
When should the reconciliation move beyond Excel?
Consider Power Query, SQL or a governed data platform when volumes, refresh frequency, collaboration, sensitivity, runtime or audit requirements make a manually operated workbook difficult to control.
Make every reporting number traceable to a controlled difference
Smart Statistics helps UK businesses design practical Excel controls, improve data quality and move repeatable reporting processes into scalable Microsoft solutions when the time is right.