

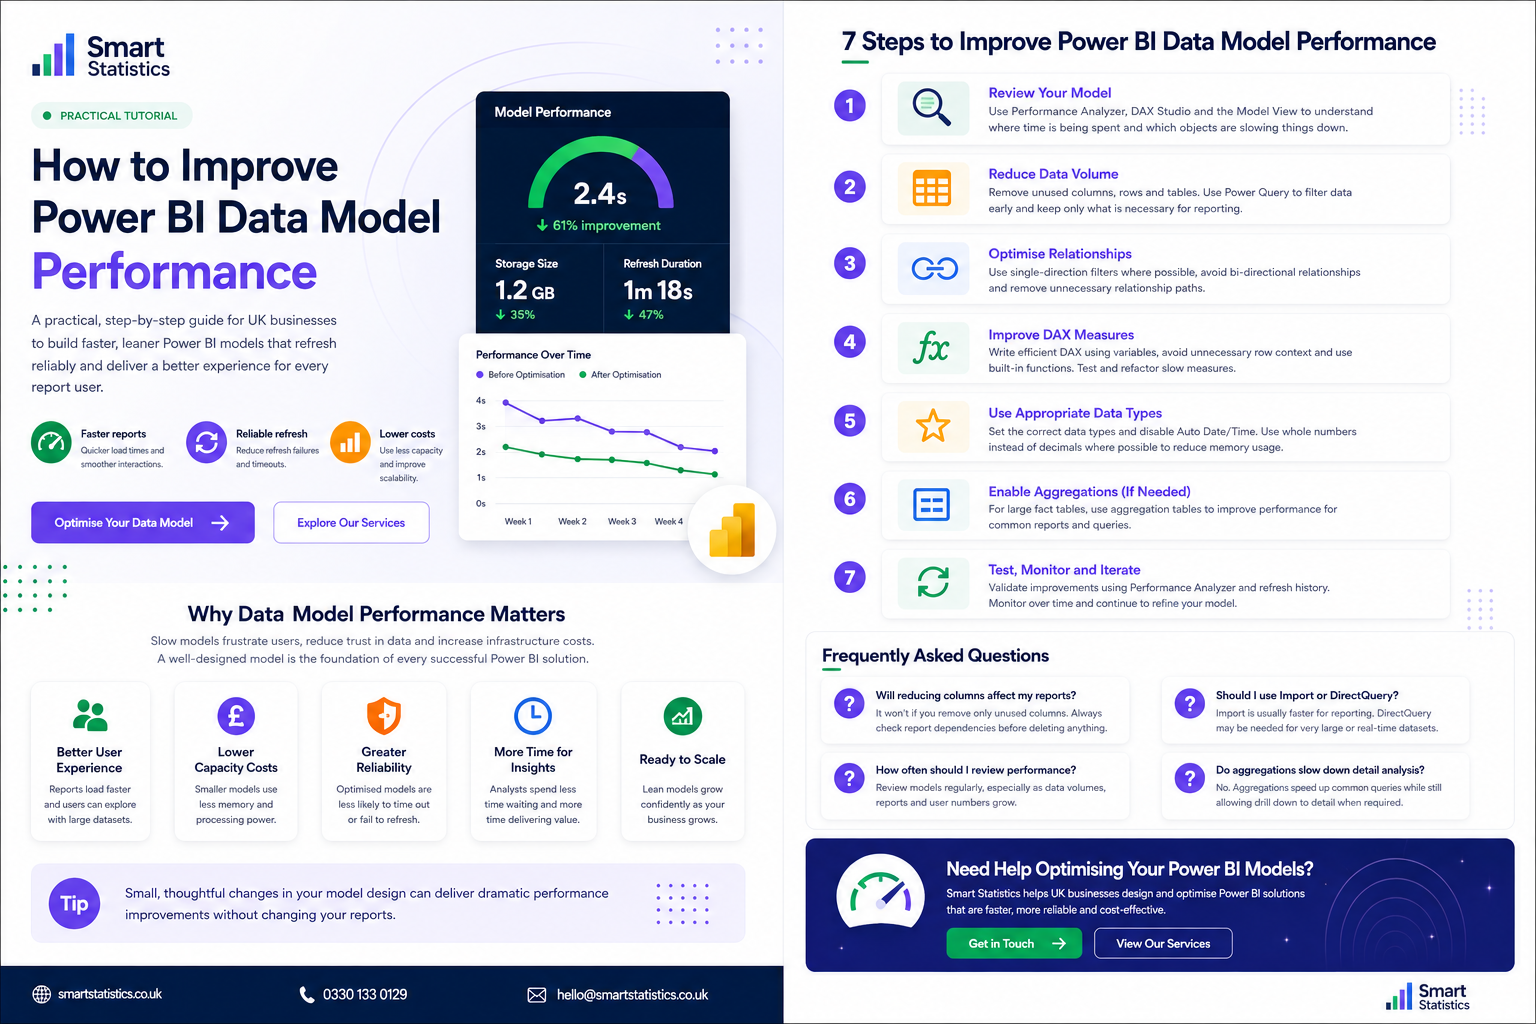
How to Improve Power BI Data Model Performance
A Power BI report can look polished and still be frustrating to use if every slicer takes several seconds to respond, refreshes regularly fail or the semantic model consumes far more capacity than the business expects.
Performance problems often begin in the data model, not the visual layer. The number of rows imported, column cardinality, relationships, DAX design and storage choices all influence how efficiently Power BI can answer a user's query.
This tutorial walks through seven practical areas you can review before assuming that the solution simply needs more capacity.
A Slow Model Creates More Than a Technical Problem
Performance affects user adoption, refresh reliability, capacity consumption and the amount of time analysts spend troubleshooting instead of delivering insight.
Better User Experience
Faster interactions make it easier for users to explore reports without waiting for every selection.
Reliable Refresh
Efficient models reduce unnecessary memory and processing pressure during scheduled refresh.
Lower Capacity Pressure
Smaller and more efficient models can reduce the amount of memory and processing required.
Greater Reliability
Leaner models are generally easier to maintain, diagnose and scale as reporting grows.
More Time for Insight
Analysts spend less time waiting for refreshes and diagnosing avoidable performance problems.
Improve the Model Systematically
Do not optimise blindly. Establish where the time and memory are being spent, make one class of improvement, then measure the result.
Review the current model
Start with evidence rather than assumptions. Identify whether the problem comes from the model, DAX measures, source queries or the visuals generating queries against the model.
Useful areas to inspect include:
- Model size and largest tables
- Columns that are never used
- High-cardinality columns
- Relationship structure
- Slow visuals
- Expensive DAX measures
- Refresh duration
Power BI Performance Analyzer can help identify visuals that take longer to execute. DAX Studio can provide deeper analysis of model and query behaviour where appropriate.
Reduce unnecessary data volume
One of the simplest ways to improve a Power BI model is to stop importing data that users never analyse.
Review every table and ask:
- Does this column appear in a visual?
- Is it used in a relationship?
- Is it referenced by a measure?
- Is the full historical range genuinely required?
- Could the data be filtered at source?
Where possible, remove unwanted columns in the source query or Power Query before they enter the semantic model.
Optimise relationships
A well-designed star schema usually gives Power BI a cleaner and more predictable filtering path.
Aim for:
- Fact tables containing measurable events
- Dimension tables containing descriptive attributes
- One-to-many relationships where practical
- Single-direction filtering unless a genuine modelling requirement exists
Avoid introducing bi-directional relationships simply to make a visual work. They can create ambiguous filter paths and make the model harder to understand.
Improve DAX measures
DAX that returns the correct number is not automatically efficient.
Start by removing repeated logic.
Instead of:
Margin % =
DIVIDE(
    SUM(Sales[Revenue]) - SUM(Sales[Cost]),
    SUM(Sales[Revenue]),
    0
)
Reuse existing measures:
Revenue =
SUM(Sales[Revenue])

Cost =
SUM(Sales[Cost])

Profit =
[Revenue] - [Cost]

Margin % =
DIVIDE(
    [Profit],
    [Revenue],
    0
)
This is easier to maintain and allows the calculation logic to be reused consistently.
Variables can also improve readability:
Margin % =
VAR RevenueValue =
    [Revenue]

VAR ProfitValue =
    [Profit]

RETURN
    DIVIDE(
        ProfitValue,
        RevenueValue,
        0
    )
Review measures that use iterators such as SUMX, FILTER or nested calculations across very large tables. Iterators are not inherently bad, but unnecessary row-by-row evaluation can become expensive.
Use appropriate data types
Power BI's columnar storage compresses different data types differently. Poor choices can increase model size unnecessarily.
Review:
- Text fields that could be numeric keys
- Decimal columns that could use whole numbers
- Date/time fields where time is not required
- Identifier columns with extremely high cardinality
Transaction IDs, GUIDs and long free-text fields can be expensive because nearly every value may be unique.
Consider aggregations for very large models
If users repeatedly ask high-level questions from a very large fact table, an aggregation strategy may reduce the amount of detailed data that needs to be scanned for common queries.
For example, instead of querying every transaction when management asks for monthly revenue by region, a pre-aggregated structure may contain:
- Month
- Region
- Category
- Total Revenue
- Total Cost
- Order Count
The detailed table can remain available for drill-through or lower-level analysis where the architecture supports it.
Test, monitor and iterate
Performance optimisation should be measurable.
After each group of changes, compare:
- Model size
- Refresh duration
- Report visual execution time
- Important DAX query performance
- Capacity or memory behaviour where applicable
Also test the actual user experience. A technical improvement is only useful if important reporting interactions become more reliable or responsive.
Before You Add More Capacity, Check These First
The model contains only fields required for reporting, relationships, calculations or security.
Unnecessary historical rows or irrelevant records are excluded before loading where practical.
Facts and dimensions are organised around clear, predictable relationships.
Cross-filtering is only used where the modelling requirement genuinely needs it.
Important slow measures have been reviewed rather than optimising arbitrary formulas.
Keys, numeric fields, dates and high-cardinality columns use appropriate types.
Model size, refresh duration and key report timings have been recorded before optimisation.
Performance has been measured after improvements rather than assumed.
Build Models That Stay Fast as They Grow
Performance optimisation should become part of model design and review rather than something addressed only after users complain.
Keep the Model Lean
Do not store data simply because it might be useful one day.
Model Before DAX
A clear relationship model often removes the need for complicated formula workarounds.
Measure the Result
Optimisation decisions should be based on observed performance rather than preference.
Review Regularly
Growth in data volume, measures and users can change the performance profile over time.
Power BI Performance FAQs
What makes a Power BI data model slow?
Will removing columns improve performance?
Should I use Import or DirectQuery?
Are bi-directional relationships always bad?
Does using variables make DAX faster?
Should I use aggregations?
How often should performance be reviewed?
How can Smart Statistics help?
Are Your Power BI Reports Getting Slower as the Business Grows?
Smart Statistics helps UK businesses diagnose and improve Power BI models that have become too large, slow, difficult to refresh or expensive to operate.
We can review your data model, DAX, Power Query, refresh architecture and report design, then focus optimisation effort where it will have the greatest practical impact.