
Smart Statistics · Power BI strategic insight
Before You Move Power BI to SQL, Find the Bottleneck
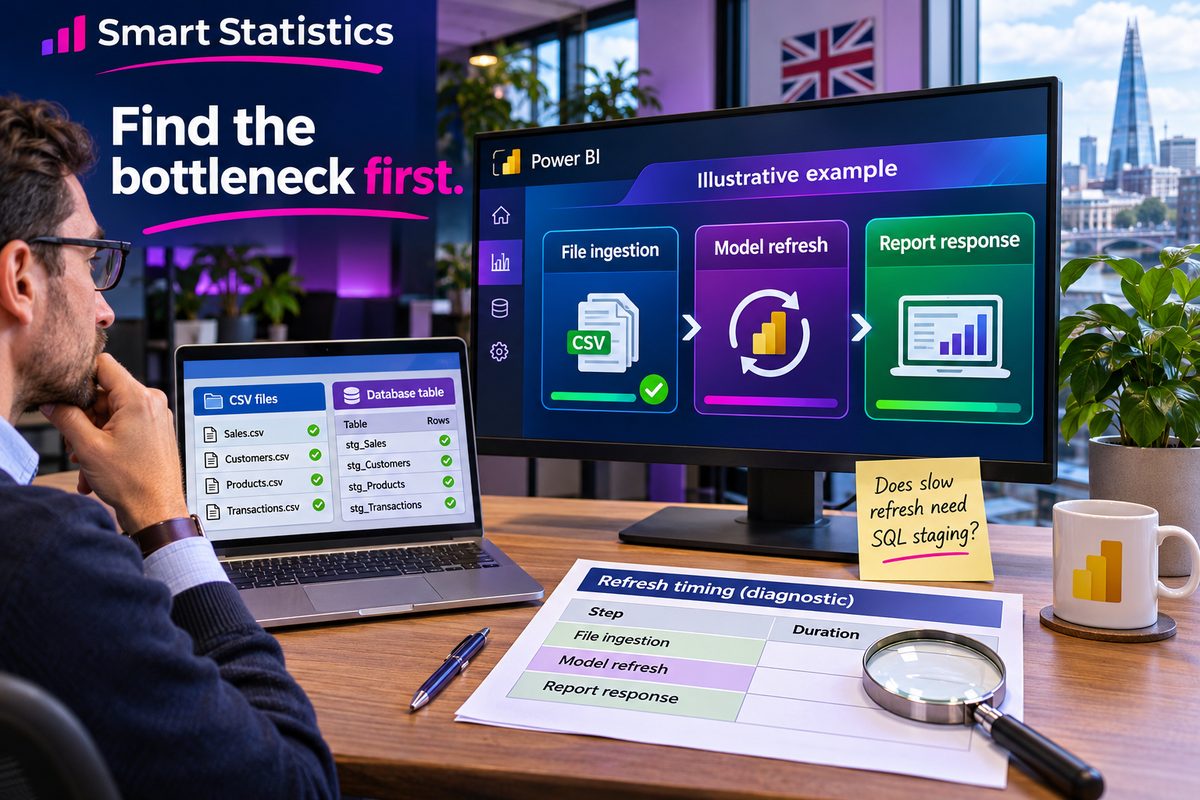
A growing folder of spreadsheets can justify a database. A slow report can justify a different fix. Measure where the time goes before choosing the architecture.
By Smart Statistics ·
Measure the whole route to usable data
Illustrative example · fictional controlled pilotElapsed time from the same available batch
Illustrative example · all chart valuesIndependent checks
Source: immutable test file batch
Correctness: agreed counts and totals reconciled
Report speed: measured separately from refresh
Files → controlled ingestion → SQL tables → Import model
An editorial dashboard, not a live Microsoft screen. The figures are invented to explain measurement, not a performance promise.
One complaint, three different problems
A UK business accumulates daily sales extracts in Excel and CSV files. Refresh takes longer each month, the model is growing and users describe the dashboard as “slow”. Those symptoms can share a cause, but they are not interchangeable.
File enumeration and parsing happen while data is prepared. Model processing happens while imported data is loaded and calculated. Report interaction happens when a user opens a page or changes a filter. Moving the source can help one stage while leaving another unchanged.
Begin with the decision the report supports and its deadline. “Ready before the morning trading meeting” is a useful requirement. “Put everything in SQL because there are many rows” is an untested design choice.
Write a diagnostic brief before a migration brief
| Symptom | Evidence to collect | First decision |
|---|---|---|
| Refresh repeatedly revisits history | Files opened, bytes read, transformation timings and refresh logs. | Test controlled ingestion of new and changed batches. |
| The imported model keeps growing | Loaded columns, distinct values, history required and table grain. | Remove unnecessary data before sizing a larger platform. |
| Slicers and visuals respond slowly | Repeatable page interactions, visual timings and query behaviour. | Investigate measures, relationships and page design. |
| Desktop works; the service misses its window | Service refresh history, gateway or network conditions, credentials and resource pressure. | Reproduce the production path before blaming the source format. |
What a SQL staging layer actually changes
A durable ingestion boundary
A separate load process accepts source files, validates their structure and commits approved data into tables. Power BI reads the prepared tables instead of repeatedly reconstructing the history from files. The benefit depends on how that load process handles changes.
A separately designed reporting model
SQL remains a source, not a replacement for model design. Keep the reporting grain, relationships and measures deliberate. Import can remain appropriate after the source changes; adopting a database does not require DirectQuery.
The ingestion process needs a batch ledger: source identifier, file fingerprint or equivalent version evidence, received time, row count, validation result and committed batch reference. A filename alone is not enough if people overwrite an existing extract with corrected data.
Agree whether a replacement file supersedes an entire period, updates individual business keys or adds new events. A blind append can duplicate the very history the database was meant to simplify. Quarantine incompatible files and retain enough lineage to explain which source supplied a reported figure.
Publish a completed batch atomically where practical, and trigger downstream refresh only after validation succeeds. Readers should not see half of a replacement period. Retain the last valid reporting state and give failed batches a visible owner.
Use a comparison that cannot hide the work
Freeze the evidence. Choose a representative source snapshot and preserve the existing model. Include normal volume, a busy period and awkward files. Record hardware, service location, gateway path and cache conditions so differences are explainable.
Compare equivalent outputs. Keep the same required history, reporting detail and business definitions for the first comparison. Reconcile counts, amounts and selected record keys by period and business unit. If a later design aggregates detail, document that as a separate trade-off rather than attributing all improvement to SQL.
Time both stages. Measure ingestion plus semantic-model refresh, including schedule waiting in the production scenario. In the illustrative dashboard, reporting only the pilot’s 12-minute model refresh would hide its 18-minute ingestion stage. The actual comparison is 54 against 30 minutes.
Repeat realistic use. Record typical and slow runs, failures and retries. Test representative report pages with the same filters and user roles. Include concurrent use where it matters. Separate cold-start behaviour from repeated cached interactions.
Challenge two tempting shortcuts
“Incremental means we only read new data”
Incremental refresh can reduce refreshed partitions, but inspect the actual source reads. Filters applied locally after expensive extraction may still retrieve far more data than expected. Microsoft describes file-based scenarios as requiring additional customisation and testing. Verify the behaviour rather than relying on the setting’s name.
“DirectQuery removes the performance problem”
DirectQuery shifts report-query work towards the source. It therefore needs testing against the database, network and expected concurrency. A smaller imported footprint is not proof of a faster user experience. Assess it separately when freshness or scale requirements justify it.
Likewise, a PBIX file’s size is a warning signal, not a complete capacity assessment. Review the published semantic model and the resources used during refresh. Check the current limits and licensing of the chosen deployment before procurement; database hosting and Power BI licensing are separate decisions.
Prove the awkward cases before rollout
Replay the same batch
Load the same input again. The result should match the agreed replay policy without unexplained duplicate business records. Record how duplicate arrival is detected.
Correct an old period
Replace a historical extract and trace the correction through staging and the model. A recent-only refresh window must not leave an approved old correction invisible.
Interrupt a load
Simulate a failure before publication. Confirm which data stays available, who receives the alert and how processing resumes without a partial reporting state.
Remove the original maker
Have a deputy run the documented recovery procedure with their authorised access. Record connection ownership, credential renewal, backups and restore responsibilities.
Choose the smallest change that meets the requirement
Optimise the existing path when unnecessary data or a small number of transformations explain the delay and the result meets the required window with growth headroom.
Adopt SQL staging when repeated file processing is a material bottleneck, corrections need controlled handling or several reports need the same prepared data. Proceed only when the measured benefit and reuse justify the ingestion and support work.
Investigate model or platform changes when the remaining constraint is model footprint, query behaviour, freshness or concurrent use. A database migration alone is not evidence that those constraints have been solved.
The business sponsor owns the freshness target and accepted trade-offs. The data owner approves corrections and completeness. The platform owner supports ingestion and recovery. The report owner checks measures, security and user acceptance. Agree these responsibilities before retiring the previous path.
Is the migration case ready for a decision?
Use this evidence check for one reporting workload. The score measures preparation, not a recommendation to buy SQL.
Make the benefit measurable after launch
Track data-ready time against the business deadline, successful scheduled loads, correction turnaround and support effort. Keep report-response timings separate. Review the results after a normal operating cycle and a busy period, using the same definitions as the pilot.
Include hosting, licensing, monitoring, backup, development and support in the operating cost. The illustrative 24-minute reduction is elapsed processing time; it is not automatically 24 minutes of staff time saved. Count staff capacity only where manual work actually falls.
Run both paths for an agreed acceptance period, explain differences to report users and retain a tested rollback route. A successful migration should make reporting more dependable as well as faster.
Common questions
Will moving CSV files into SQL make my Power BI model smaller?
Not automatically. If the same rows and columns are imported at the same detail, the source change alone does not establish a smaller model. Review the required data, types and reporting grain separately.
Should I switch to DirectQuery when I adopt SQL?
Not by default. SQL can feed an Import model. DirectQuery changes how report queries reach the source and needs its own performance, concurrency and security assessment.
Does incremental refresh mean old files are never read?
No. Verify which source data is actually read. A filter applied after expensive file processing may reduce the returned rows without removing the upstream work.
What is the minimum evidence for a migration decision?
Compare a representative baseline and pilot using reconciled outputs, end-to-end freshness, refresh reliability, report response and operating cost. Include a correction, a replay and a failed load before approving rollout.
Bring the slow refresh. Leave with an evidence-based plan.
Smart Statistics can assess the file pipeline, Power BI model and reporting workload, then help you choose and validate the change that addresses the actual constraint.