

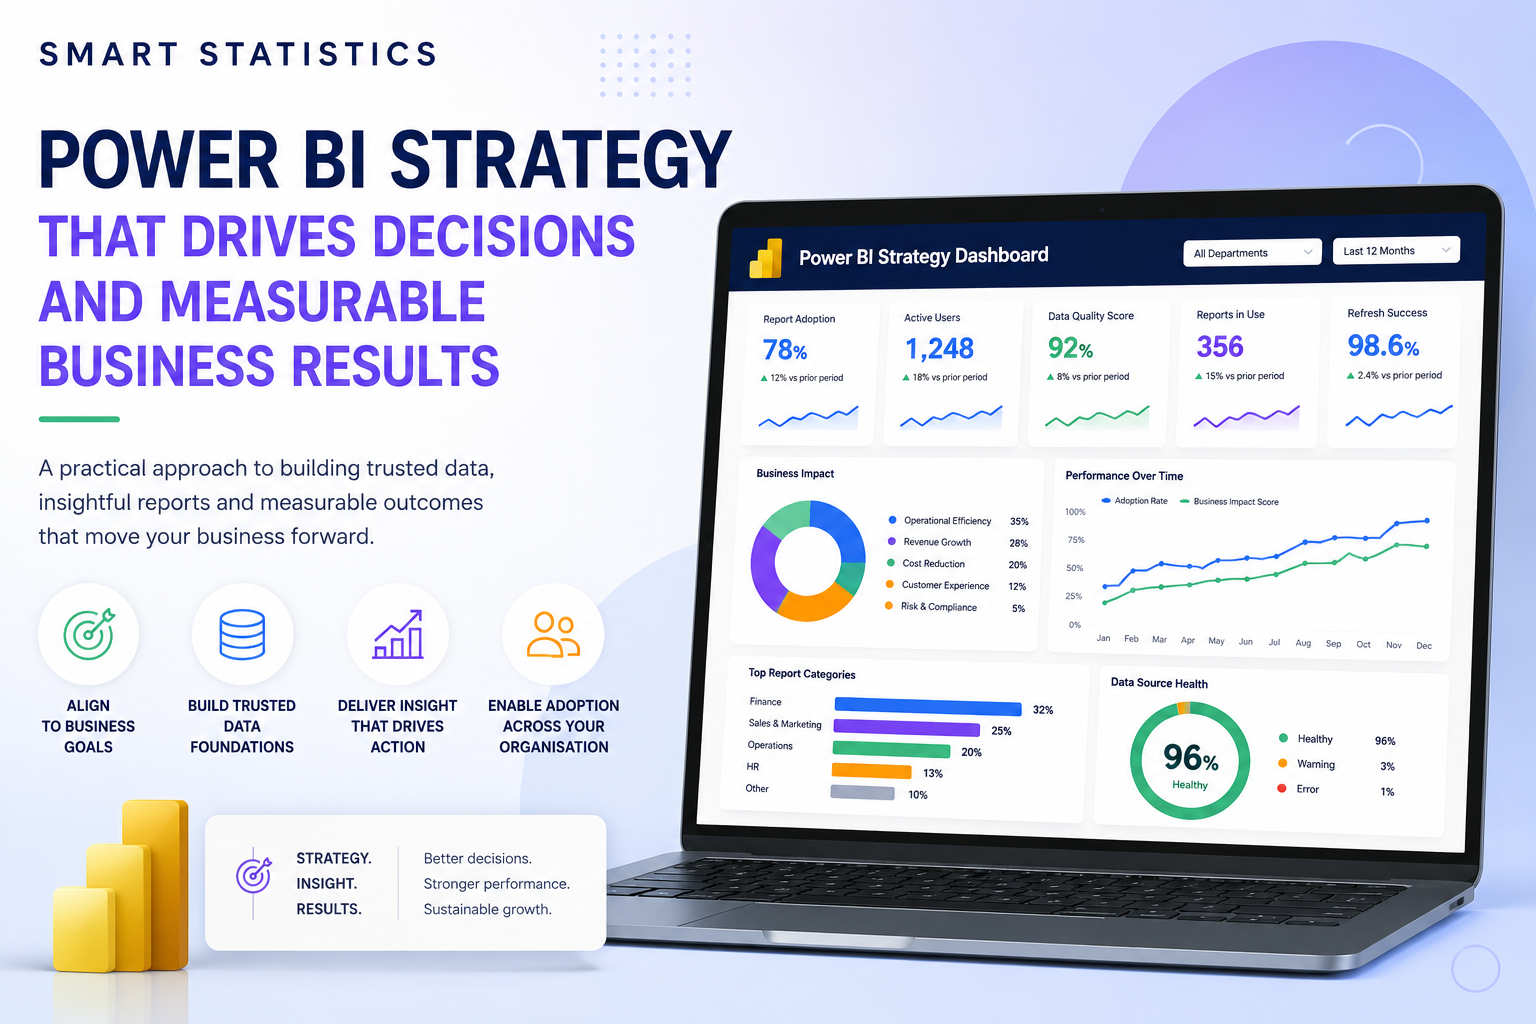
Power BI Strategy That Drives Decisions and Measurable Business Results
Power BI can transform how an organisation understands performance, but technology alone does not create better decisions. Sustainable value comes from a clear strategy that connects business priorities, trusted data, useful reporting, governance and user adoption.
This guide explains how UK business leaders can build a practical Power BI strategy that turns reporting investment into measurable operational and commercial outcomes.
Report Adoption Trend
Content by Business Area
Data Quality
Top Insights Delivered
Move from Reporting Activity to Decision Impact
Many organisations begin using Power BI because they want faster reporting, improved visualisation or reduced reliance on spreadsheets. Initial dashboards can deliver quick wins, but problems often emerge as demand increases.
Different teams may calculate the same metric in different ways. Reports can multiply without clear ownership. Users may export data back into Excel because they do not trust the dashboard. Refresh failures, duplicated models and unclear security rules can gradually increase cost and operational risk.
A Power BI strategy provides the structure needed to prevent this fragmented growth. It aligns reporting with business priorities and establishes how data, technology, people and governance will work together.
What should a Power BI strategy achieve?
- Prioritise reporting according to business objectives and decisions.
- Create consistent, trusted definitions for important measures.
- Establish scalable data models and reporting architecture.
- Improve report usability, adoption and decision-making behaviour.
- Control access, quality, ownership and lifecycle risk.
- Measure whether Power BI is delivering genuine business value.
Why Power BI Initiatives Lose Momentum
Power BI problems are rarely caused by visual design alone. They are usually symptoms of gaps in strategy, data management, ownership or adoption.
Unclear Business Priorities
Reports are commissioned in response to individual requests rather than a clear view of organisational priorities.
- Too many low-value reports
- Conflicting stakeholder expectations
- No agreed measure of success
Inconsistent Data
Different reports use different source systems, transformations or definitions for the same business measure.
- Conflicting versions of the truth
- Time lost reconciling numbers
- Reduced confidence in decisions
Low User Adoption
Technically correct reports fail because users find them confusing, slow, irrelevant or difficult to access.
- Continued reliance on manual files
- Weak stakeholder engagement
- Limited confidence in self-service
Manual Reporting Effort
Teams continue copying, checking and distributing data manually, even after Power BI has been introduced.
- Slow reporting cycles
- High administrative overhead
- Greater risk of human error
Weak Governance
Ownership, access, certification, deployment and retirement rules are unclear or inconsistently applied.
- Security and compliance exposure
- Duplicated datasets and reports
- Unsupported business-critical content
No Value Measurement
Success is measured by the number of dashboards created rather than changes in efficiency, quality, risk or performance.
- Unclear return on investment
- Difficult prioritisation decisions
- Limited continuous improvement
Six Pillars of a High-Value Power BI Strategy
A successful strategy must address more than software configuration. It should define how the organisation selects, builds, manages, adopts and improves its business intelligence capability.
Business Alignment
Start with the decisions, outcomes and performance questions the organisation needs to address.
- Strategic objectives and KPIs
- Priority decisions and use cases
- Business sponsorship and accountability
Trusted Data Foundations
Establish reliable source data, shared definitions and reusable semantic models.
- Data quality and reconciliation
- Consistent business definitions
- Scalable model design
Insight-Led Reporting
Design reports around decisions and actions rather than presenting every available data point.
- Clear visual hierarchy
- Actionable measures and exceptions
- Role-specific reporting experiences
User Adoption
Treat adoption as a business change programme rather than a training activity delivered at the end.
- Stakeholder participation
- Role-based guidance and support
- Usage monitoring and feedback
Governance and Control
Apply proportionate standards for security, ownership, publishing, certification and lifecycle management.
- Workspace and access strategy
- Development and release controls
- Ownership and support responsibilities
Value and Improvement
Monitor performance, adoption and business outcomes so the reporting estate continues to improve.
- Operational and commercial benefits
- Usage, quality and reliability metrics
- Continuous optimisation roadmap
A Practical Five-Step Power BI Strategy
The strategy should translate into a sequenced roadmap that balances immediate value with long-term scalability.
Assess
Review reports, data sources, stakeholders, technology, governance, pain points and current levels of adoption.
Define
Agree business priorities, reporting principles, target outcomes, KPIs, ownership and measures of success.
Design
Create the target data architecture, semantic model approach, governance framework and reporting standards.
Deliver
Build prioritised solutions iteratively, test with users and release improvements through controlled deployment.
Optimise
Monitor adoption, reliability, performance and business value, then refine the roadmap continuously.
The Difference a Power BI Strategy Makes
A strategy changes Power BI from a collection of individual dashboards into a governed and measurable business capability.
| Capability | Without a Clear Strategy | With a Power BI Strategy |
|---|---|---|
| Reporting priorities |
Reactive
Reports are created in response to individual requests and the loudest stakeholder. |
Aligned
Investment is prioritised according to business goals, decisions and measurable value. |
| Data consistency |
Conflicting
Multiple reports calculate the same measure differently. |
Trusted
Shared definitions and governed models create consistent results. |
| User experience |
Variable
Report quality depends on the individual creator. |
Purposeful
Reports follow clear design standards and support specific decisions. |
| Adoption |
Limited
Users continue to rely on spreadsheets and manual workarounds. |
Embedded
Insight becomes part of regular operational and management routines. |
| Governance |
Informal
Ownership, access and publishing practices are inconsistent. |
Controlled
Roles, permissions, quality standards and lifecycle controls are defined. |
| Value measurement |
Unclear
Success is described through dashboard counts and activity. |
Outcome-led
Success is measured through adoption, efficiency, quality, risk and business performance. |
What an Effective Strategy Should Deliver
The value of Power BI should be visible in business performance, not simply in technical output.
Decision-Making
Give leaders timely access to trusted performance information.
Reporting Effort
Reduce manual preparation, reconciliation and distribution.
Data Confidence
Create consistent measures that stakeholders can trust.
User Adoption
Build reporting experiences that support real working practices.
Make the Strategy Practical and Sustainable
The strongest Power BI strategies are specific enough to guide action, but flexible enough to evolve as business priorities and technology change.
Characteristics of an effective roadmap
Your roadmap should combine quick operational improvements with foundational work that supports future scale.
The objective is not to create more dashboards. It is to give the right people trusted information at the right time, so they can make better decisions and take effective action.
Power BI Strategy FAQs
Answers to common questions from organisations planning to improve or scale their Power BI capability.
What is a Power BI strategy?
Why do we need a strategy if we already use Power BI?
What should a Power BI strategy include?
How long does it take to develop a Power BI strategy?
Do we need to rebuild all our existing reports?
How do we measure whether the strategy is working?
How does governance support Power BI adoption?
Can Smart Statistics review our current Power BI environment?
Turn Power BI Insight into Measurable Business Impact
Smart Statistics helps UK organisations create practical Power BI strategies that connect trusted data, effective reporting, strong governance and user adoption.
Whether you need to review an existing reporting estate, improve performance or define a scalable roadmap, we can help you focus your investment on the decisions and outcomes that matter.