

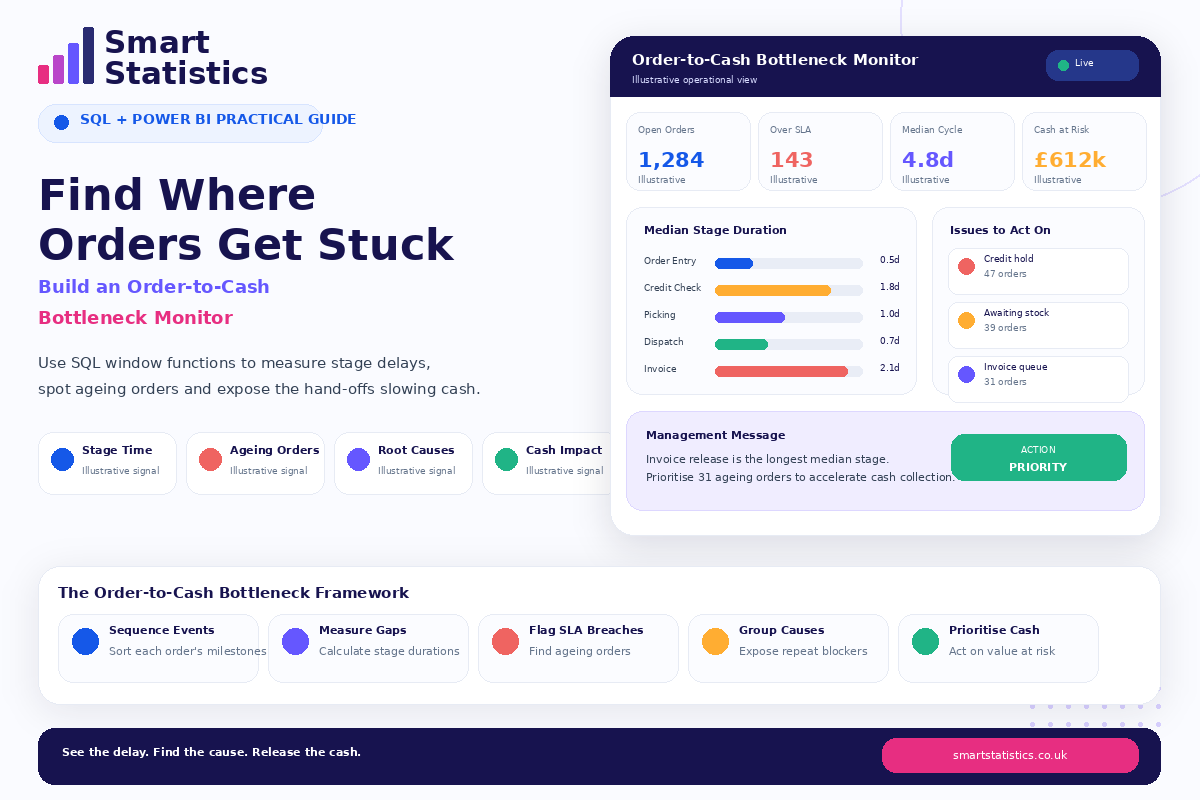
Find Where Orders Get Stuck
A customer order can look perfectly healthy in a headline sales report while quietly sitting in a credit queue, waiting for stock, awaiting dispatch or remaining uninvoiced.
Traditional reporting often measures the final result. Bottleneck analysis measures the time between the events that created it.
In this tutorial, you will use SQL window functions to turn an order-event history into stage durations, SLA breaches, ageing flags and a Power BI action view showing where operational delays are holding up cash.
Median Stage Duration
Issues Requiring Action
Invoice release is the longest illustrative median stage. Prioritise ageing, high-value orders before month-end.
“Order Took Seven Days” Does Not Tell You Why
Total cycle time is useful, but it does not identify which hand-off, queue or control caused the delay.
Long Waiting Time
Orders can spend more time waiting between teams than being actively processed.
Queue Build-Up
A team may appear productive while unfinished work accumulates immediately before or after it.
Poor Hand-Offs
The delay may sit between departments rather than inside a single department's own work.
Cash Is Delayed
If invoicing or fulfilment is late, operational delay can eventually become a working-capital problem.
Turn the Process into Dated Events
Instead of keeping only the current order status, retain the important milestones that show how the order moved through the process.
Order Created
Capture the commercial starting point.
Credit Released
Measure time waiting for financial approval.
Picked
Track the warehouse fulfilment milestone.
Dispatched
Measure the delay before goods leave the site.
Invoiced
Identify when the order becomes billable.
Build the Bottleneck Monitor Step by Step
Create an Order Event Table
The most useful starting structure is one row per order event rather than one row per order.
OrderID | EventType       | EventTime
--------|-----------------|--------------------
10001   | Order Created   | 2026-08-03 09:14
10001   | Credit Released | 2026-08-03 12:46
10001   | Picked          | 2026-08-04 08:28
10001   | Dispatched      | 2026-08-04 14:51
10001   | Invoiced        | 2026-08-05 10:06
Add useful business attributes where available:
- Customer
- Region
- Order value
- Product group
- Site or warehouse
- Account manager
Use LEAD() to Find the Next Event
SQL window functions are useful because they let you compare rows inside the same order without losing the event-level detail.
WITH SequencedEvents AS (
    SELECT
        OrderID,
        EventType,
        EventTime,

        LEAD(EventType) OVER (
            PARTITION BY OrderID
            ORDER BY EventTime
        ) AS NextEventType,

        LEAD(EventTime) OVER (
            PARTITION BY OrderID
            ORDER BY EventTime
        ) AS NextEventTime

    FROM dbo.OrderEvents
)

SELECT *
FROM SequencedEvents;
Calculate the Time Between Events
Once the next timestamp is available, calculate elapsed time for the stage.
WITH SequencedEvents AS (
    SELECT
        OrderID,
        EventType,
        EventTime,

        LEAD(EventType) OVER (
            PARTITION BY OrderID
            ORDER BY EventTime
        ) AS NextEventType,

        LEAD(EventTime) OVER (
            PARTITION BY OrderID
            ORDER BY EventTime
        ) AS NextEventTime

    FROM dbo.OrderEvents
)

SELECT
    OrderID,
    EventType,
    NextEventType,
    EventTime,
    NextEventTime,

    DATEDIFF(
        MINUTE,
        EventTime,
        NextEventTime
    ) AS StageMinutes

FROM SequencedEvents
WHERE NextEventTime IS NOT NULL;
Minutes provide flexibility. You can convert them to hours or days later according to the reporting need.
Compare Each Stage with an SLA
Create a small rules table containing the expected duration of each stage.
StageName        | SlaMinutes
-----------------|-----------
Order Created    | 240
Credit Released  | 480
Picked           | 720
Dispatched       | 480
Join the event-duration result to the rule table:
SELECT
    e.OrderID,
    e.EventType,
    e.NextEventType,
    e.StageMinutes,
    s.SlaMinutes,

    CASE
        WHEN e.StageMinutes > s.SlaMinutes
            THEN 1
        ELSE 0
    END AS IsSlaBreach

FROM EventDurations e

LEFT JOIN dbo.StageSla s
    ON e.EventType = s.StageName;
Add Order Value and Prioritise Material Delays
Two overdue orders are not necessarily equally important.
Add the commercial value of each order so the operations team can distinguish between:
- Low-value routine exceptions
- High-value orders approaching month-end
- Strategic customer orders
- Orders repeatedly breaching the same stage
An illustrative priority rule:
CASE
    WHEN IsSlaBreach = 1
         AND OrderValue >= 50000
        THEN 'Critical'

    WHEN IsSlaBreach = 1
         AND OrderValue >= 10000
        THEN 'High'

    WHEN IsSlaBreach = 1
        THEN 'Review'

    ELSE 'Normal'
END AS ActionPriority
Build an Action-Focused Power BI Page
Do not stop with a chart showing average lead time. Give the user enough context to act.
- Open orders
- Orders currently over SLA
- Median stage duration
- Order value currently delayed
- Longest stage
- Top bottleneck reason
- High-priority ageing orders
Add a detailed action table containing:
- Order number
- Customer
- Current stage
- Time in stage
- SLA
- Order value
- Reason code
- Owner
A Bottleneck Dashboard Should Change What Happens Next
Process analytics becomes useful when the insight is linked to ownership and a practical operational response.
Resolve Credit Holds
Separate genuine credit risk from transactions simply waiting for review.
Prioritise Stock
Surface high-value orders that are ready to progress once missing stock is available.
Clear Invoice Queues
Identify completed fulfilment that is still waiting to become an invoice.
Fix Recurring Causes
Use trend analysis to distinguish isolated exceptions from structural process problems.
Order-to-Cash Analytics FAQs
What is order-to-cash bottleneck analysis?
Why are SQL window functions useful here?
Should I use LEAD() or LAG()?
Should stage time use calendar hours or working hours?
Can this approach be used outside order-to-cash?
Can Power BI calculate the stage durations instead?
Does cash at risk mean the full order value will be lost?
How can Smart Statistics help?
Stop Measuring Only How Many Orders You Have. Measure Where the Time Is Going.
Smart Statistics helps UK businesses turn operational event data into reporting that reveals waiting time, bottlenecks, exceptions and the transactions that deserve attention first.
Whether the process sits in sales, finance, operations, service delivery or supply chain, the objective is the same: make hidden delays visible before they become larger customer, cost or cash-flow problems.