

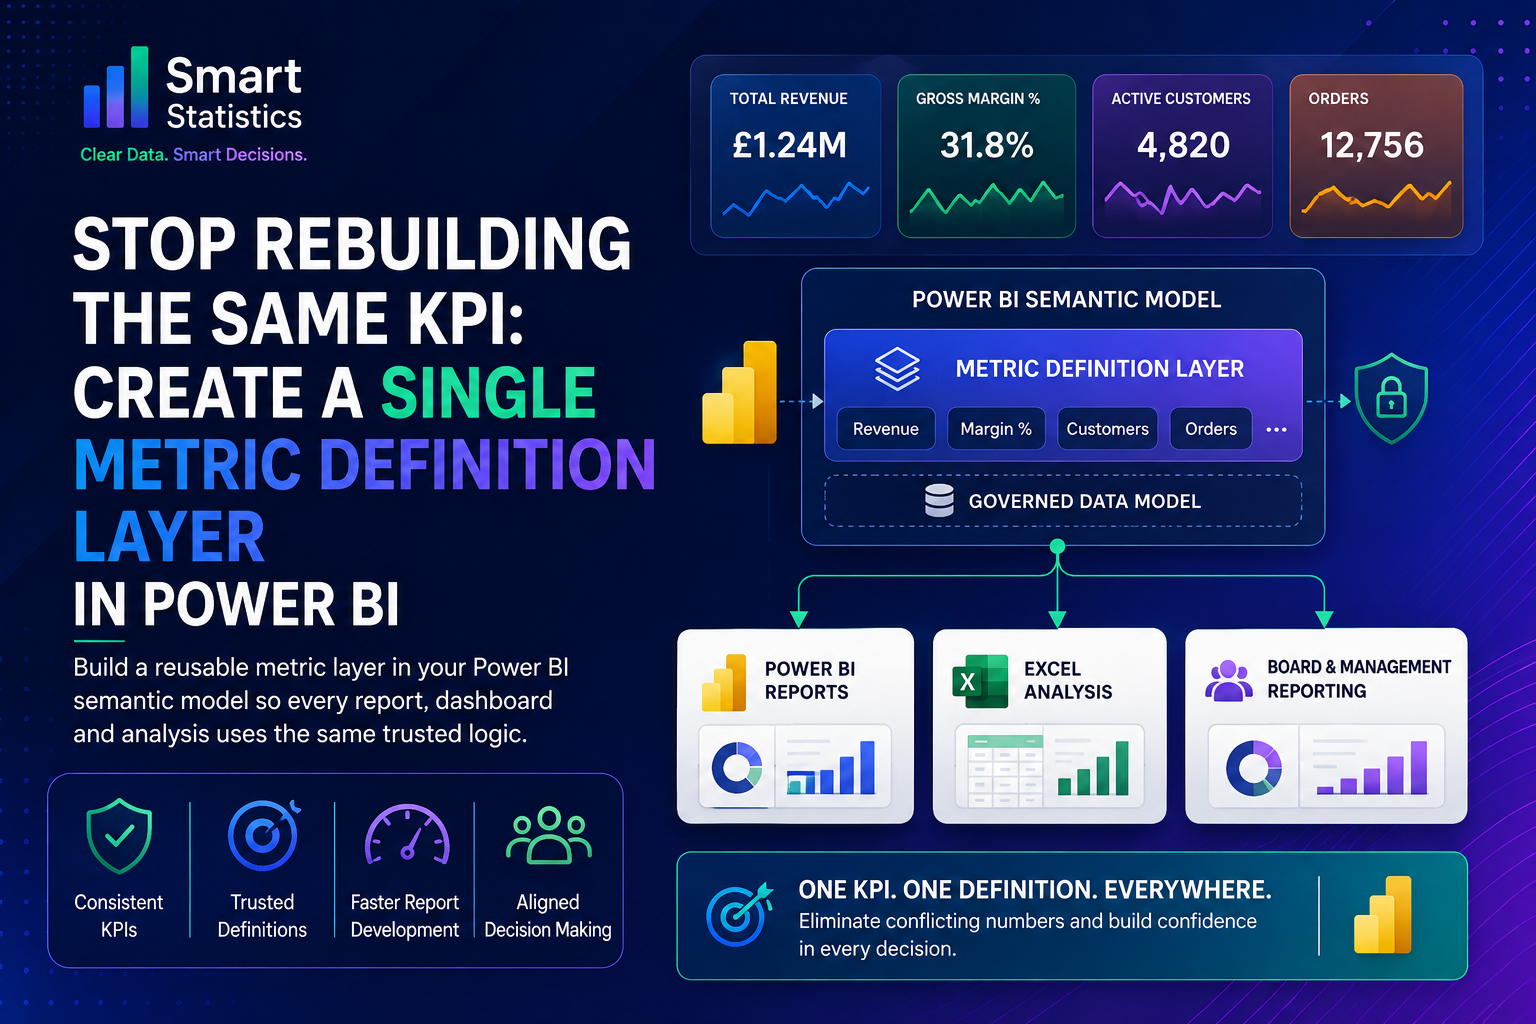
Stop Rebuilding the Same KPI in Every Report
Create a single reusable metric definition layer in Power BI so finance, operations, management reporting and connected analysis all work from the same governed business logic.
Reuse the same business measure across multiple reports.
Stop rebuilding common calculations inside every report.
Give important metrics a documented business definition.
Build new reports from trusted measures instead of starting again.
The same KPI often means different things in different reports.
A dashboard may show Gross Margin %, another Power BI report may calculate it slightly differently, and a finance workbook may contain a third version.
Each calculation can be technically valid while still creating a business problem. If nobody has agreed the definition, executives are left comparing numbers that look identical but do not represent the same logic.
This is not primarily a visualisation problem. It is a metric governance problem.
- Report developers spend time recreating measures that already exist elsewhere.
- Management meetings become discussions about whose number is correct.
- Changes to business logic have to be applied manually across several separate reports.
(Revenue - Cost of Sales) / Revenue
(Revenue - Direct Cost) / Revenue
Gross Profit / Net Revenue
Illustrative example of definition drift
Put reusable business measures in the semantic model.
Instead of embedding important KPI logic inside every report, create a governed metric layer that defines the measures once and allows reporting outputs to reuse them.
Central business logic
Define core measures such as revenue, margin, units, active customers and productivity in one controlled model.
Governed definitions
Document what each metric means, what it excludes and who is responsible for agreeing future changes.
Reusable reports
New Power BI reports can concentrate on layout and analysis instead of reproducing the same calculation layer.
Reports should ideally consume trusted measures rather than becoming separate calculation engines with their own interpretations of every KPI.
Build KPIs from reusable base measures.
A strong metric layer usually begins with simple reusable base measures. More complex business KPIs can then reference those measures rather than repeatedly summing columns inside every calculation.
This measure defines the approved revenue aggregation once. Other calculations can reuse it.
The important principle is not the specific formula above. Your organisation may define revenue, cost or margin differently. The objective is to agree the business definition and then encode that definition once.
A formula can be technically valid while still representing the wrong commercial definition. Metric governance needs business ownership as well as technical implementation.
A measure needs more than a DAX formula.
A governed KPI should explain how the business should interpret the number, not merely how Power BI calculates it.
| Definition component | Example | Why it matters |
|---|---|---|
| Metric name | Gross Margin % | Gives users one consistent business label. |
| Business definition | Gross profit as a percentage of recognised revenue. | Explains the meaning without requiring DAX knowledge. |
| Formula | Gross Profit / Total Revenue | Defines how the metric is calculated. |
| Source data | Sales and cost transactions | Shows where the measure originates. |
| Grain | Transaction level | Clarifies the level at which underlying data is stored. |
| Exclusions | Cancelled transactions | Prevents different reports applying different filters. |
| Time logic | Transaction date | Avoids disagreement about which date controls reporting. |
| Display format | Percentage, 1 decimal place | Keeps presentation consistent across reports. |
| Business owner | Finance Director | Establishes who approves definition changes. |
The example above is illustrative. Metric ownership should reflect the governance structure of the organisation using the model.
Treat important KPIs like shared business assets.
Metric governance does not need to become a large bureaucracy. A lightweight framework can still prevent substantial reporting inconsistency.
Define
Agree the business meaning before writing the final measure.
Document
Record logic, exclusions, source data and interpretation notes.
Own
Assign responsibility for approving future definition changes.
Reuse
Encourage reports to consume the shared measure instead of recreating it.
Review
Revisit definitions when the business process or source data changes.
Move from report-owned logic to model-owned logic.
Report-owned KPI logic
- Every report contains its own version of the measure.
- Business logic changes must be applied in several places.
- Developers may interpret exclusions differently.
- Excel extracts can create another independent version.
- Management receives conflicting numbers.
Governed semantic model
- Important KPIs are defined once.
- Reports reuse existing calculations.
- Definitions are documented and owned.
- Changes can be managed centrally.
- Reporting conversations focus more on decisions than reconciliation.
Keep the metric layer understandable.
Governance works best when report developers can easily understand which measures should be reused and how they are intended to behave.
Use clear measure names
Prefer names such as Total Revenue and Gross Margin % over technical abbreviations that only the original developer understands.
Separate base and derived measures
Build complex KPIs from simpler reusable measures so the model is easier to test and maintain.
Add descriptions
Document important measures so users understand the intended business meaning without opening the DAX.
Reuse existing measures
Before creating a new KPI, confirm that an approved version does not already exist in the model.
Standardise time logic
Reuse consistent year-to-date, prior-year and rolling-period logic rather than rebuilding time calculations independently.
Control exceptions
If a report genuinely needs a different definition, name it clearly rather than silently changing a shared KPI.
Let reports focus on the question, not recreate the model.
Once a reusable semantic model exists, individual reports can become much lighter. Their primary job is to provide the right visual experience for a particular audience or business process.
An executive dashboard, operational report and finance analysis can all present different views while consuming the same core business measures.
That does not mean every report must look the same. It means the underlying meaning of a shared KPI should remain stable.
Uses [Total Revenue] and [Gross Margin %]
Uses [Total Revenue] and [Gross Margin %]
Uses [Total Revenue] and [Gross Margin %]
Your metric layer probably needs attention if these conversations sound familiar.
Common warning signs
- “Which revenue number are we using?”
- “Finance has a different margin percentage.”
- “This report excludes cancellations but that one does not.”
- “We need to update the DAX in five separate PBIX files.”
- “The Excel pack still has the old calculation.”
What good looks like
- Business users know where the approved definition lives.
- Core measures have clear owners.
- New reports reuse existing KPIs by default.
- Definition changes are deliberate and documented.
- Management spends less time reconciling numbers.
Power BI metric governance FAQs
What is Power BI metric governance?
Metric governance is the practice of agreeing, documenting and maintaining important business measures so the same KPI means the same thing wherever it is used.
Why should KPIs be defined in the semantic model?
A shared semantic model allows several reports to reuse the same calculation logic. This reduces duplication and makes changes easier to control.
Should report developers ever create local measures?
Local measures can still be appropriate for genuinely report-specific analysis. The key distinction is whether the measure represents a shared business KPI. Shared KPIs should normally come from the governed model.
What should a KPI definition contain?
At minimum, consider the business meaning, calculation, source data, exclusions, time logic, display format and owner. More complex metrics may also require additional interpretation or data-quality notes.
Can the same model support finance and operational reporting?
Yes, provided the underlying data model and security design support those use cases. Different reports can present different views while still reusing shared business measures.
How should KPI definition changes be handled?
Treat significant changes as governed business decisions. Confirm the owner, record what changed, test the downstream impact and communicate the revised interpretation to users.
Stop debating whose KPI is correct.
Smart Statistics helps UK businesses design Power BI reporting architectures with reusable semantic models, governed measures and clear business definitions. If your dashboards, finance reports and Excel packs are producing competing versions of the same KPI, we can help you create a more consistent reporting layer.