

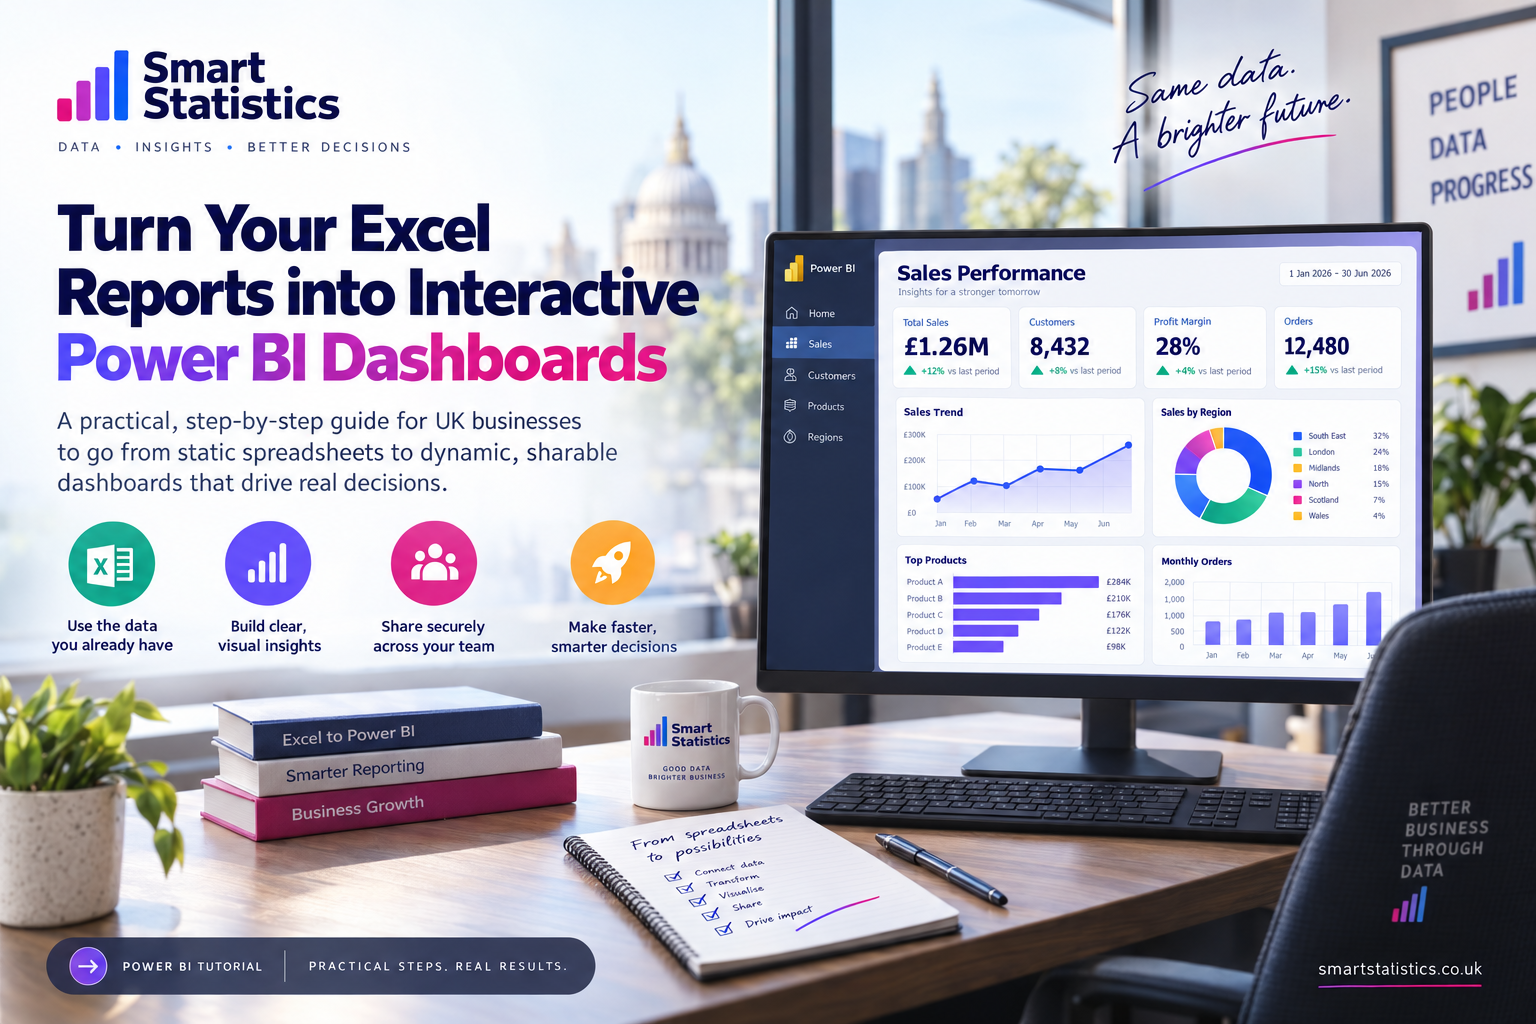
Turn Your Excel Reports into Interactive Power BI Dashboards
Excel remains one of the most useful business tools available. The problem begins when a spreadsheet that started as a useful analysis becomes a recurring reporting system.
Files are copied each month. Formulas are extended. Charts are refreshed manually. Different versions circulate by email. Somebody eventually asks whether the numbers are still current.
Power BI can move that reporting process from a static workbook into a governed, interactive and refreshable experience — without throwing away the business knowledge already embedded in the Excel report.
Monthly Sales Trend
Sales by Region
Recreate the business logic, not every formatting decision in the original spreadsheet.
Excel Is Not the Problem. The Reporting Process Around It Might Be.
A spreadsheet can remain perfectly appropriate for analysis. The warning signs appear when the workbook becomes the entire reporting infrastructure.
Multiple Versions
Reports circulate by email and people cannot easily tell which workbook contains the current numbers.
Manual Refresh
Somebody repeatedly downloads data, pastes it into worksheets and updates formulas before the report can be distributed.
Limited Interaction
Users ask for another spreadsheet whenever they need a different customer, region, product or date breakdown.
Key-Person Dependency
One person understands which tabs must be refreshed, which formulas must be copied and which errors can be ignored.
Do Not Convert the Workbook. Rebuild the Reporting Process.
A successful Power BI migration separates the different jobs that Excel may currently be performing inside one file.
Source
Identify the original data rather than relying on copied report tabs.
Transform
Move repeatable cleansing and shaping into Power Query.
Model
Build reusable relationships between facts and dimensions.
Measure
Define KPIs centrally using reusable DAX measures.
Publish
Give users a controlled, interactive report experience.
Build the Power BI Version in Seven Stages
Audit the Existing Excel Report
Before opening Power BI, understand what the workbook is actually doing.
Document:
- Original data sources
- Manual imports
- Lookup tables
- Business calculations
- Filters and exclusions
- Users and audiences
- Refresh frequency
- Critical outputs
Separate Data from Presentation
Many Excel reports mix raw records, formulas, subtotal rows, charts and presentation logic in the same workbook.
Power BI works better when the source resembles structured data:
OrderID
OrderDate
CustomerID
ProductID
RegionID
Quantity
SalesValue
CostValue
Avoid using source tables that contain:
- Blank separator rows
- Manually inserted subtotals
- Merged cells
- Several header rows
- Colour-coded business logic
Rebuild Repetitive Cleaning in Power Query
Transformations that employees repeat manually should become repeatable query steps wherever practical.
Common Power Query tasks include:
- Changing data types
- Removing unnecessary columns
- Filtering invalid records
- Replacing inconsistent values
- Merging reference tables
- Appending monthly files
- Creating clean reporting fields
Build a Simple Data Model
Resist the temptation to load one enormous spreadsheet table and build everything directly from it.
A common model might contain:
FactSales
    ↳ DimDate
    ↳ DimCustomer
    ↳ DimProduct
    ↳ DimRegion
This structure helps create reusable filtering, clearer measures and more scalable reporting.
Replace Worksheet Formulas with Measures
Business calculations should become reusable measures rather than formulas copied down thousands of rows.
For example:
Total Sales =
SUM ( FactSales[SalesValue] )

Total Cost =
SUM ( FactSales[CostValue] )

Gross Profit =
[Total Sales] - [Total Cost]

Gross Margin % =
DIVIDE (
    [Gross Profit],
    [Total Sales]
)
Central measures give multiple visuals the same definition of sales, cost, profit and margin.
Design for Decisions, Not Decoration
Do not reproduce every cell, chart and tab from the original workbook.
Start with the questions managers need to answer:
- What changed?
- Where did it change?
- What is driving the change?
- Which customers or products require attention?
- How does performance compare with target or prior period?
A useful first page might contain:
- Four to six headline KPIs
- A time trend
- A regional or category comparison
- A ranked performance visual
- Simple slicers for the most useful dimensions
Publish, Secure and Refresh
The final step is not simply pressing Publish. Decide how the report will be operated.
Confirm:
- Workspace ownership
- User access
- Row-level security where required
- Refresh ownership
- Gateway requirements
- Failure notifications
- Report support responsibilities
Is Your Excel Report Ready for Power BI?
Select the statements that apply to your current reporting process. This is an illustrative readiness check rather than a formal assessment.
Current Reporting Process
Tick the statements that are already true.
Illustrative Readiness Score
The score reflects only the items selected on this page.
Select the controls already in place for the report.
Four Principles for Sustainable Power BI Reporting
Define KPIs Once
Put important business definitions into reusable measures instead of recreating calculations in individual visuals.
Give Reports Owners
Every important report should have clear ownership for business logic, data quality and ongoing changes.
Monitor Refresh
A dashboard that refreshed yesterday should not silently present itself as today's information.
Secure the Model
Control access through appropriate workspaces, applications and security rules rather than distributing uncontrolled files.
Excel to Power BI FAQs
Can Power BI replace Excel reporting?
Can Power BI connect directly to an Excel file?
Do I need to learn DAX?
Should I recreate every Excel tab in Power BI?
Can Power BI refresh automatically?
What happens to the existing Excel workbook?
Can different users see different data?
How can Smart Statistics help?
Your Best Power BI Dashboard May Already Be Hiding Inside an Excel Workbook.
The workbook already contains valuable business knowledge: KPIs, calculations, categories, filters and reporting requirements. The opportunity is to separate that knowledge from the manual process required to maintain the spreadsheet.
Smart Statistics helps UK businesses move from recurring spreadsheet reporting to structured Power BI solutions that are easier to refresh, share, govern and scale.