

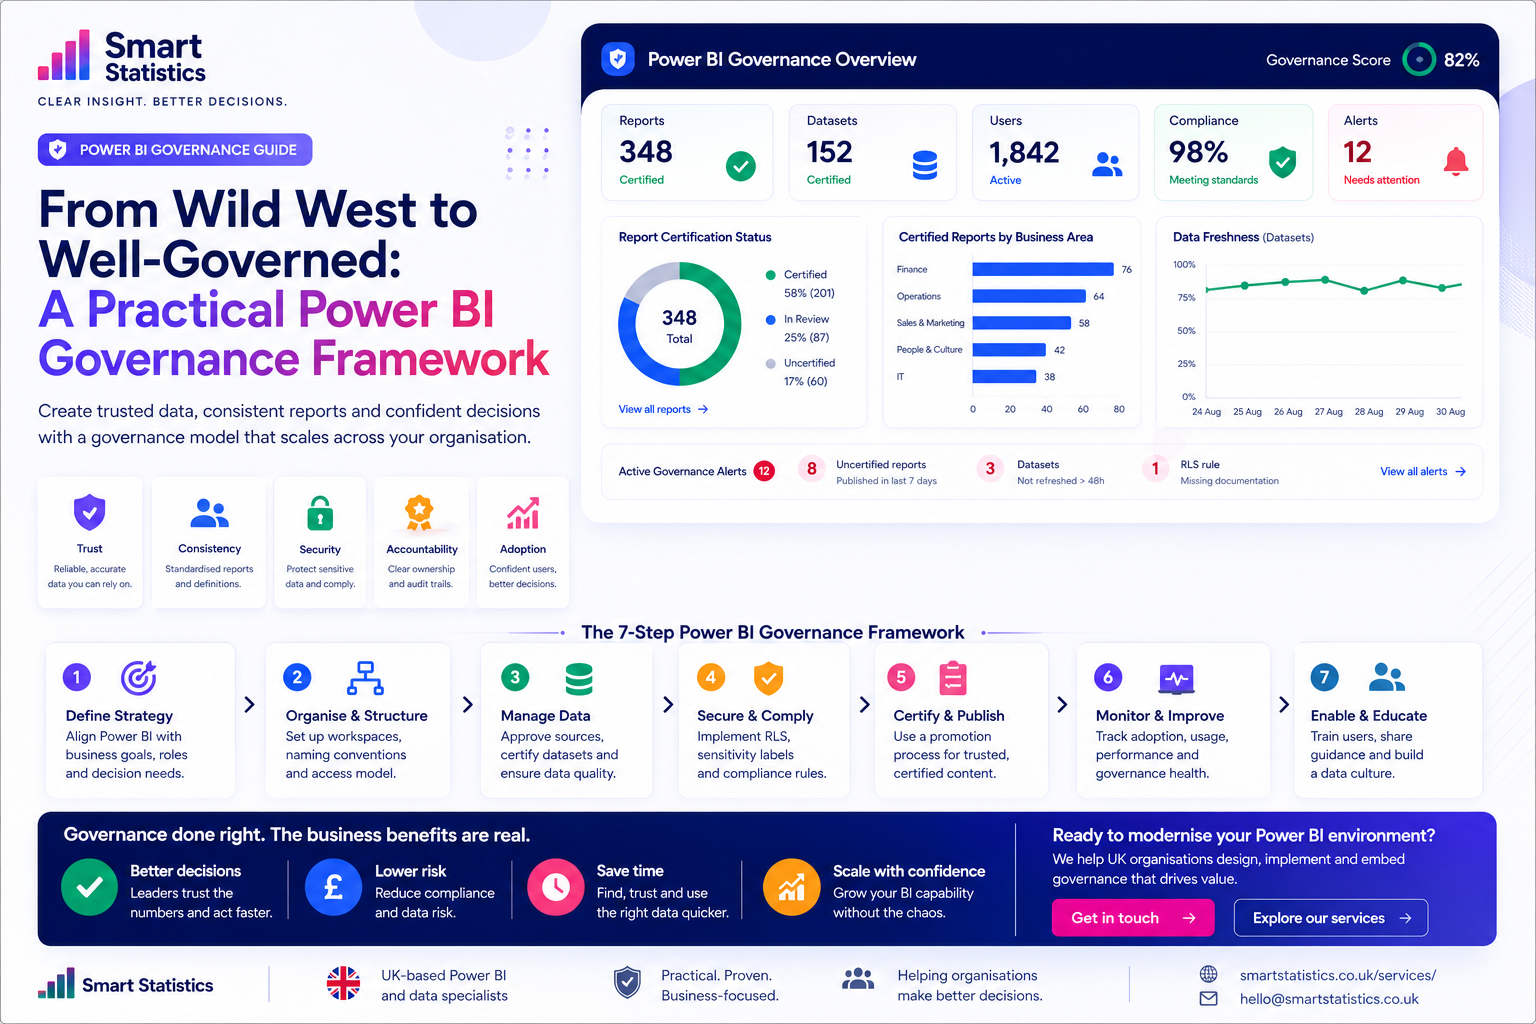
From Wild West to Well-Governed: A Practical Power BI Governance Framework
Power BI often starts small. One analyst builds a report. Another department creates its own dashboard. A few months later, dozens of reports exist — and several show different versions of the same KPI.
That is not a Power BI problem. It is a governance problem.
The goal is not to stop self-service analytics. The goal is to create enough structure that people can move quickly without destroying trust in the numbers.
Report Certification Status
Illustrative distributionCertified Content by Business Area
Illustrative coverageWhat Happens When Everybody Builds Their Own Version?
Self-service reporting creates enormous value — until duplicated logic, unclear ownership and inconsistent definitions start reducing trust.
Duplicate Reports
Similar dashboards appear across departments with slightly different filters, measures and definitions.
Conflicting KPIs
Revenue, headcount, margin or service measures can produce different answers depending on who built them.
Unclear Ownership
A critical report may be used every Monday even though nobody knows who is responsible for maintaining it.
Security Drift
As content spreads, access patterns become harder to understand and sensitive data may be shared too widely.
Governance Is Not All or Nothing
Most organisations evolve through stages. The right governance model should match the size, risk and complexity of the reporting environment.
Ad Hoc
Individuals build reports independently with little shared structure, documentation or ownership.
Controlled
Workspaces, access and critical reports begin to follow shared standards.
Governed
Trusted semantic models, certification, ownership and monitoring become normal operating practice.
Optimised
Governance metrics, adoption data and continuous improvement guide how the environment evolves.
Build Power BI Governance in Seven Practical Areas
Define What Governance Is Trying to Protect
Do not start with rules. Start with the business risk.
Ask which reports influence:
- Executive decisions
- Financial reporting
- Operational planning
- Customer commitments
- Regulatory or contractual obligations
Those reports need stronger controls than a temporary personal analysis used by one analyst.
Create a Workspace and Naming Structure
Workspaces should make purpose and ownership obvious.
A simple structure could separate:
- Development
- Testing / validation
- Production
- Departmental self-service
- Personal or exploratory analysis
Naming conventions should help users understand:
- Business area
- Purpose
- Environment
- Owner
Reduce the Number of Competing Data Models
If ten reports calculate the same KPI independently, eventually one of them will disagree.
Identify reusable trusted semantic models for common business domains such as:
- Finance
- Sales
- Customers
- Workforce
- Operations
- Inventory
Reuse should become easier than rebuilding.
Make Security Part of the Design
Security should not be checked only when the report is ready to publish.
Governance should define:
- Who can create production content
- Who can publish apps
- Who manages workspace access
- Where row-level security is required
- How sensitive datasets are identified
- Who reviews access periodically
Create a Trust and Certification Process
Users need to know which reports and models can be relied upon for formal decisions.
A certification checklist might confirm:
- Named business owner
- Named technical owner
- Validated business definitions
- Approved data source
- Security review completed
- Refresh behaviour confirmed
- Documentation available
Once these conditions are met, trusted content can be promoted clearly.
Monitor Governance Health
Governance should become visible in the same way operational performance is visible.
Useful governance metrics include:
- Reports without named owners
- Inactive or unused reports
- Stale semantic models
- Refresh failures
- Uncertified production content
- Workspace access exceptions
- Certified-content coverage
- Usage of trusted versus untrusted content
Enable People Instead of Policing Them
Governance fails when users only experience it as a set of restrictions.
Support self-service with:
- Approved templates
- Reusable semantic models
- Report design standards
- Naming guidance
- Security guidance
- Training and office hours
- A clear publishing route
The easier the governed path becomes, the less incentive users have to work around it.
How Controlled Is Your Power BI Environment?
Use this illustrative checklist as a quick conversation starter. It is not a formal compliance assessment.
Governance Controls
Tick the practices currently in place.
Illustrative Governance Score
This score simply counts the checklist items above.
The Objective Is Business Confidence
Governance is valuable when it improves trust, reduces risk and makes the reporting environment easier to use.
Trust
Leaders can distinguish validated reporting from exploratory analysis.
Consistency
Shared models and definitions reduce competing versions of key business metrics.
Accountability
Important reports have clear business and technical owners.
Scalable Adoption
Self-service analytics can grow without creating uncontrolled reporting sprawl.
Power BI Governance FAQs
What is Power BI governance?
Does governance prevent self-service reporting?
Do all Power BI reports need certification?
Who should own a Power BI report?
How often should access be reviewed?
Should old reports be deleted?
Can governance itself be reported in Power BI?
How can Smart Statistics help?
Self-Service Analytics Should Scale Insight — Not Confusion.
Smart Statistics helps UK businesses create Power BI environments where users can move quickly while critical reporting remains trusted, secure and maintainable.
Whether you currently have twenty reports or several hundred, governance does not need to begin with a complicated programme. It can start with clear ownership, trusted models, sensible workspace structure and visibility of the exceptions that matter.