Power BI Accessibility: Design Reports People Can Actually Use Smart Statistics · Strategic insight Power BI Accessibility: Design Reports People Can Actually Use A...
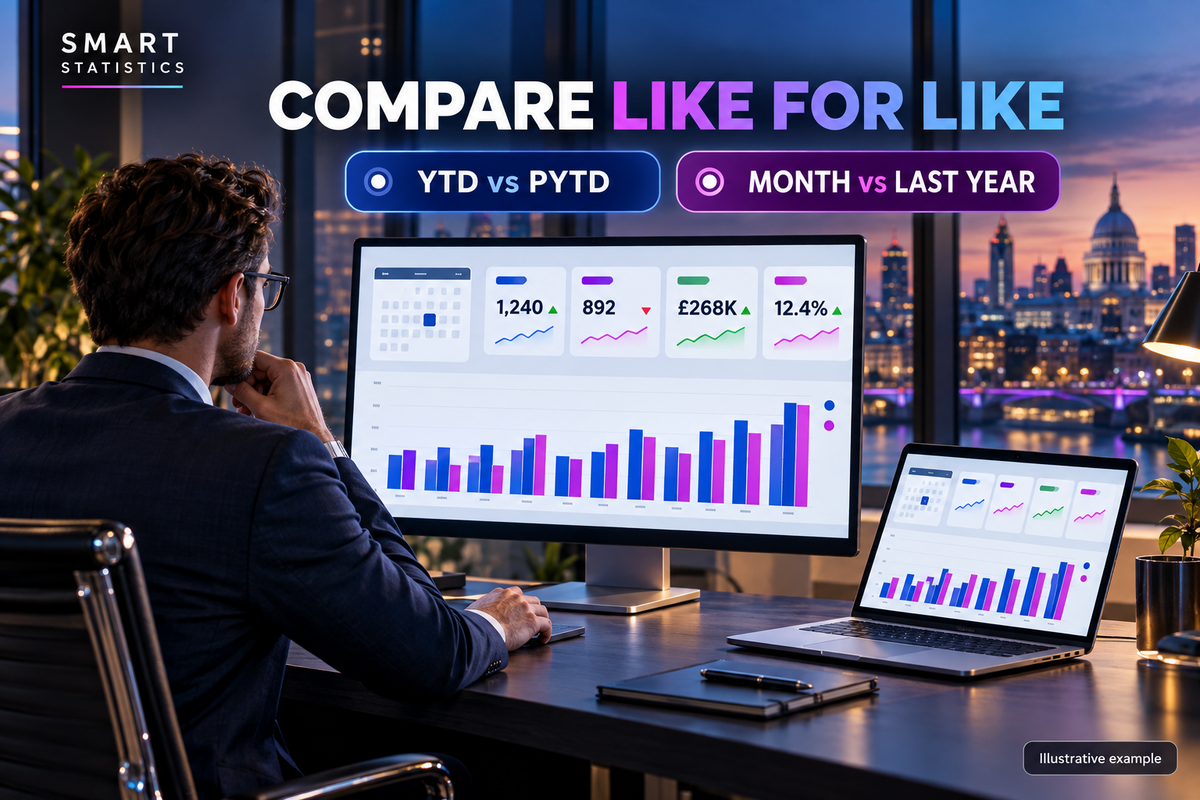
Power BI Period Comparison: Compare Like for Like | Smart Statistics Smart Statistics · Power BI tutorial Make every period comparison like for like...
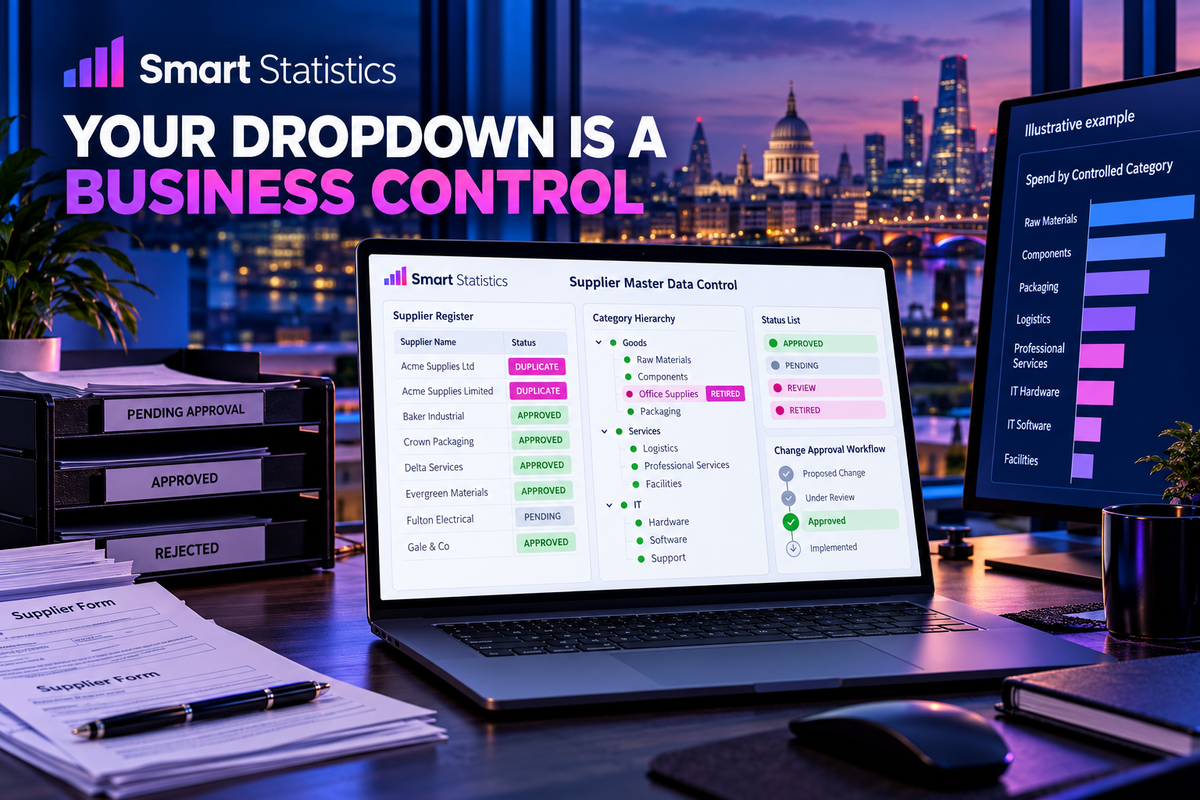
Reference Data Governance: Treat Dropdowns as Controls | Smart Statistics SMART STATISTICS · DATA GOVERNANCE Your dropdown list is a business control Supplier names,...
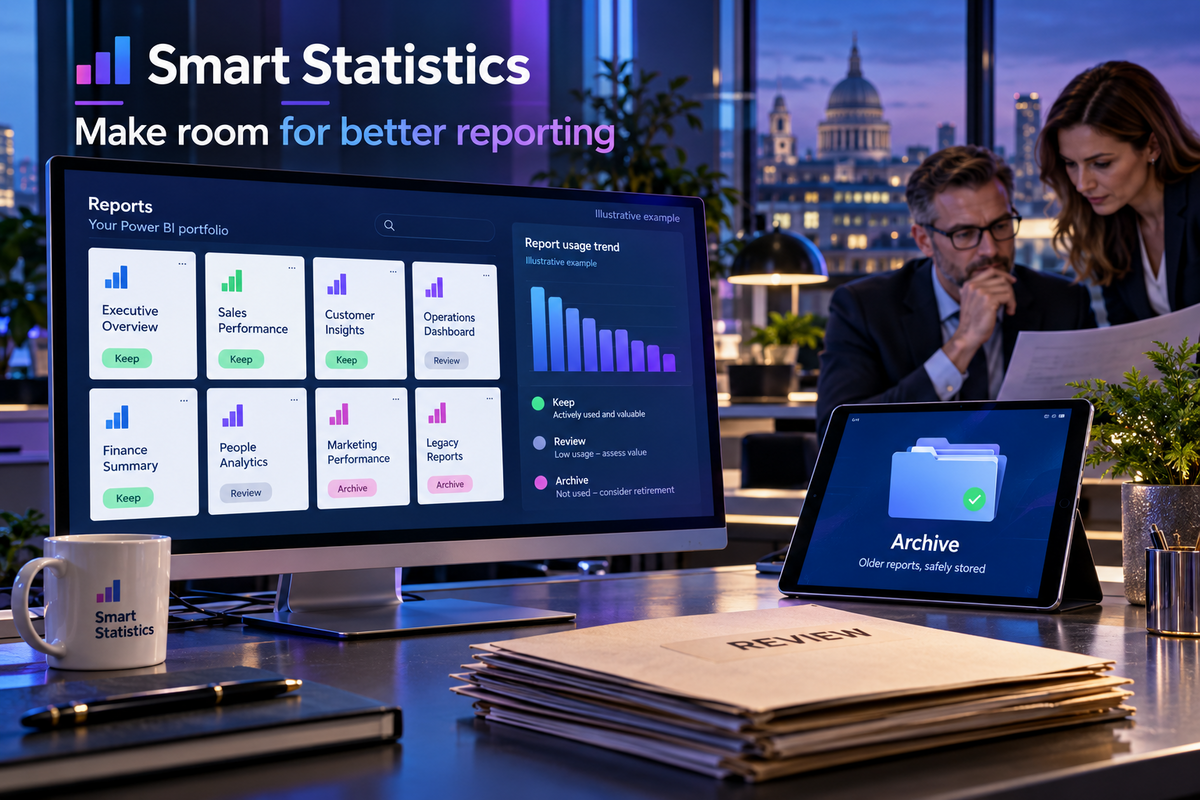
Power BI Report Retirement: A Practical Business Guide SMART STATISTICS · BUSINESS INSIGHT Power BI report retirement: make room for better decisions Every report...
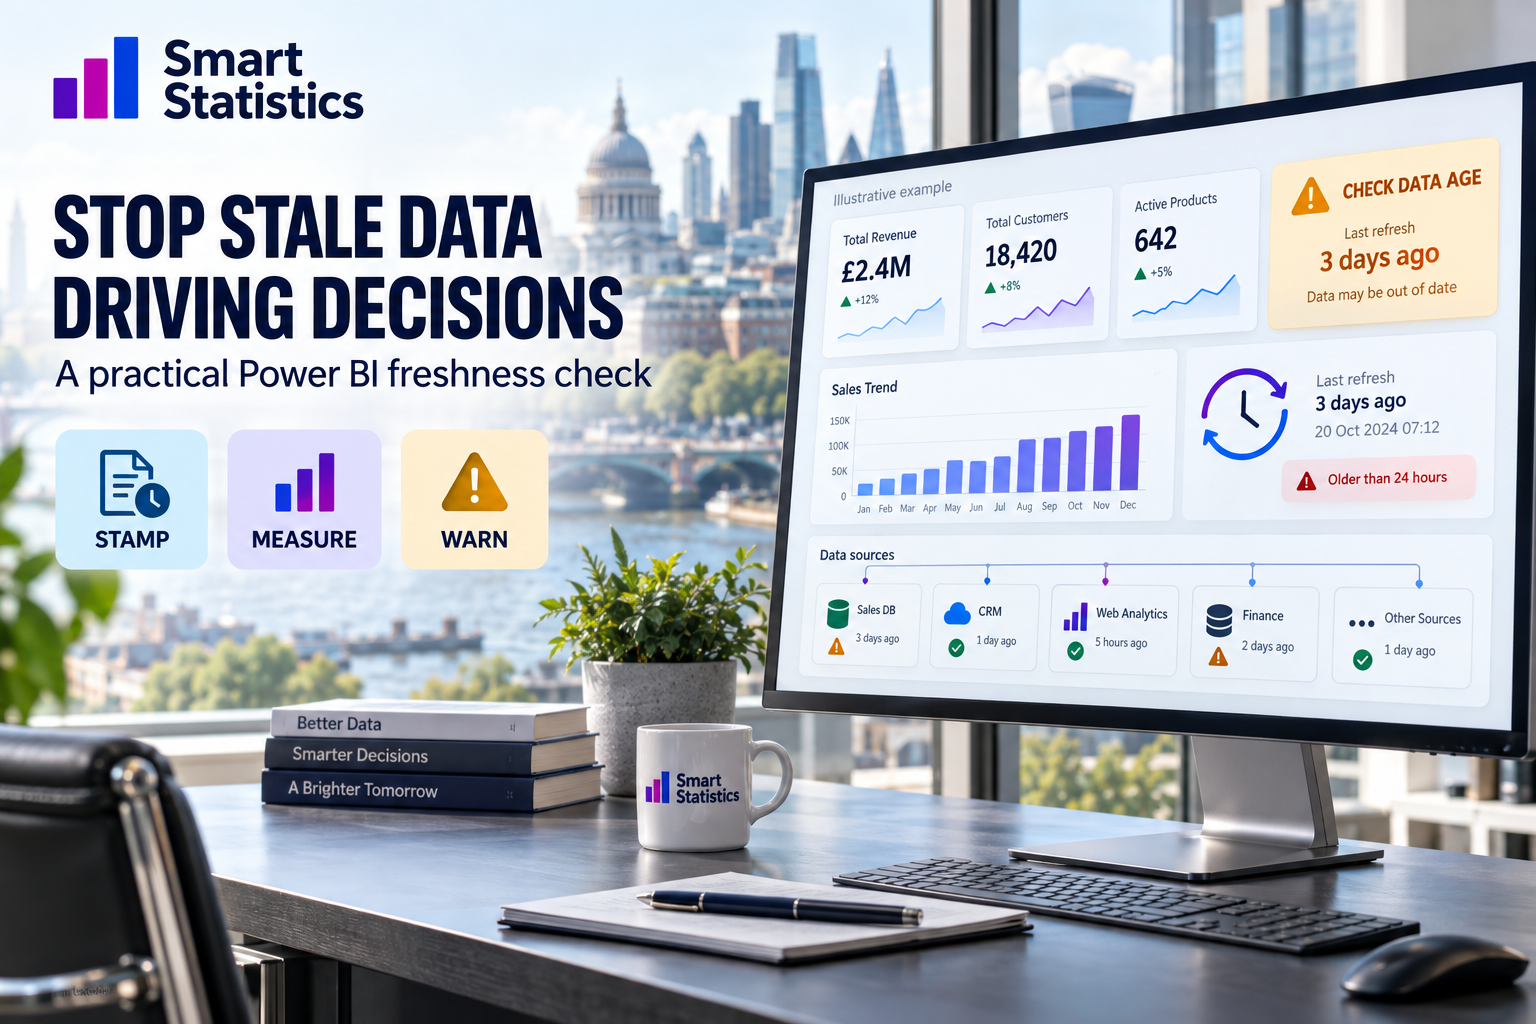
Power BI Refresh Timestamp: Build a Stale-Data Warning Smart Statistics · Practical Power BI tutorial Stop stale data driving decisions Build a visible refresh...
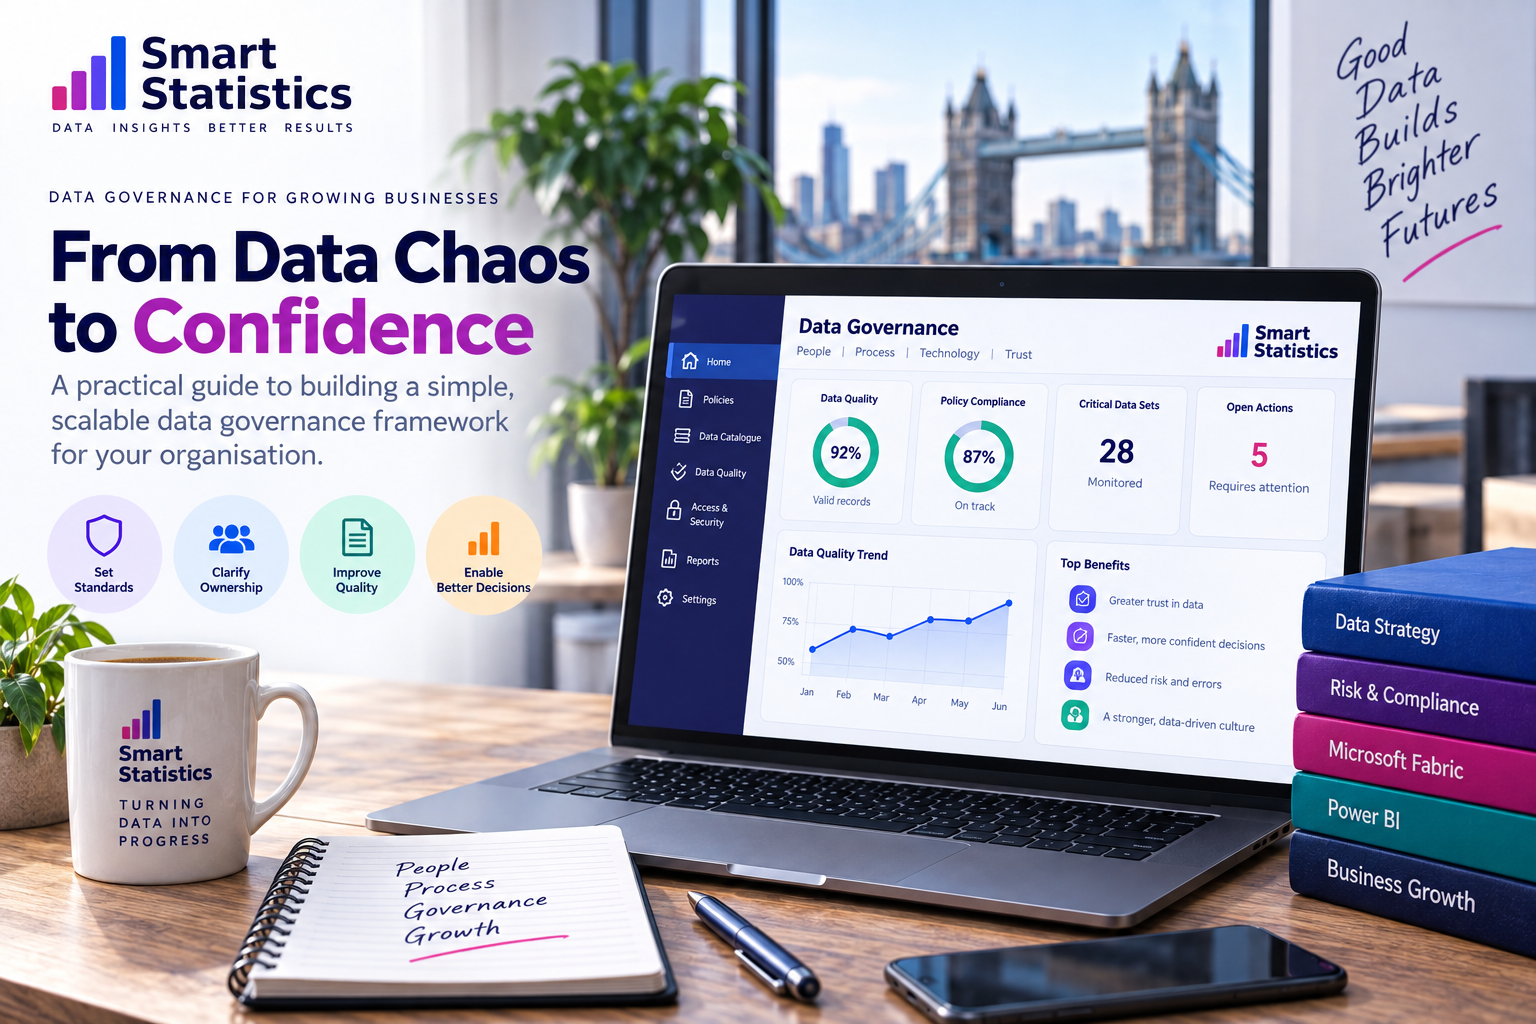
Build a Practical Data Governance Framework | Smart Statistics Data Governance for Growing Businesses From Data Chaos to Confidence Growth creates data faster than...
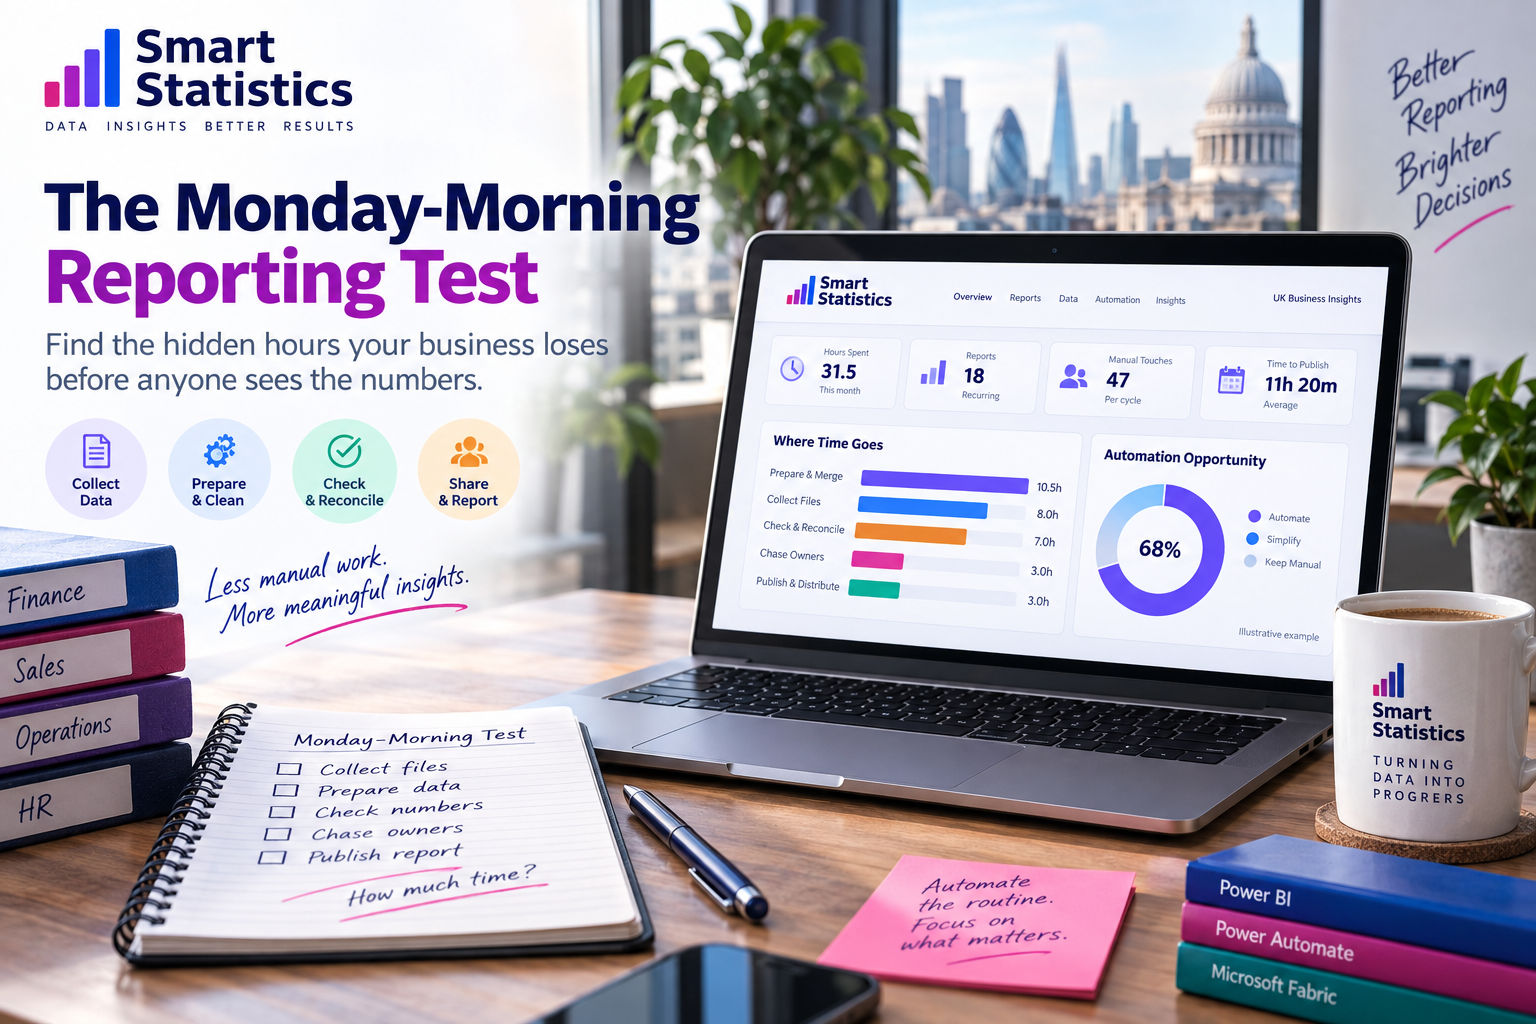
The Monday-Morning Reporting Test | Smart Statistics Reporting Process Insight The Monday-Morning Reporting Test: Find the Hidden Hours Your Business Loses Before Anyone Sees...
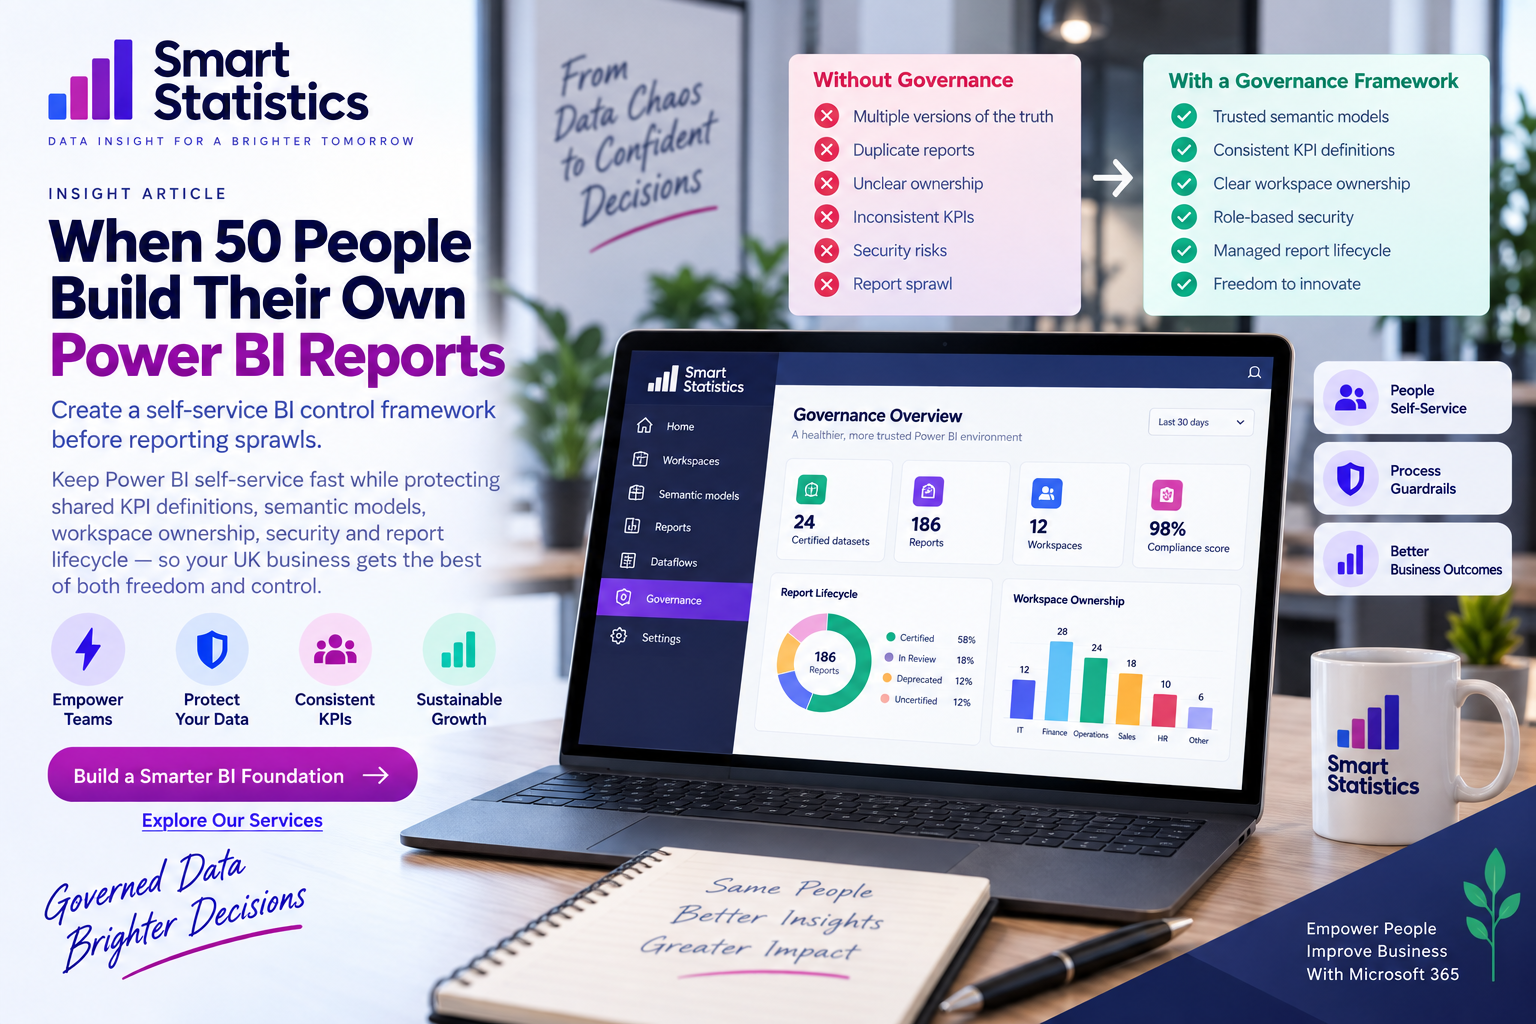
Power BI Self-Service Governance Framework | Smart Statistics Power BI Governance Insight When 50 People Build Their Own Power BI Reports Self-service analytics often...