

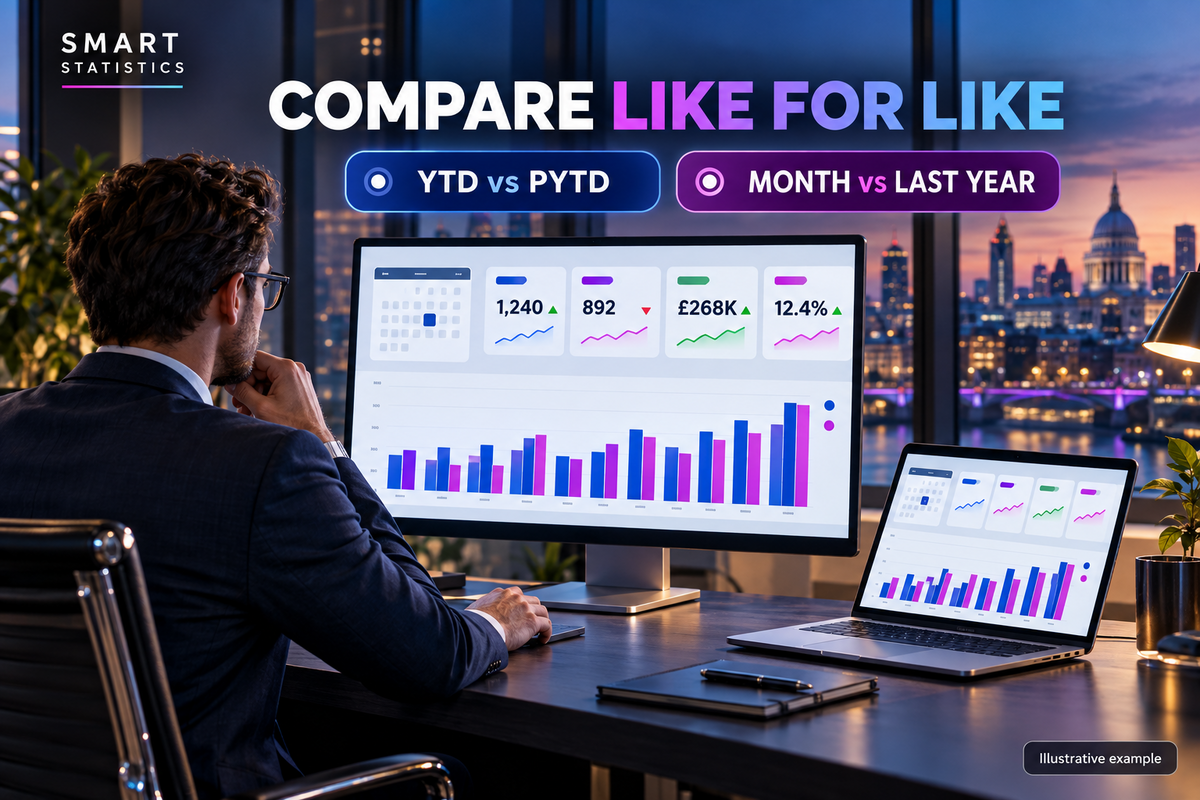
Make every period comparison like for like
Build one Power BI comparison that defaults to year to date versus the same months last year, then switches to a selected month versus that month one year earlier.
The result is a report that answers the question the user actually asked—without asking them to understand filter context first.
10 October 2026 · Microsoft Power BI · UK business reporting
Revenue comparison
The arithmetic can be right and the decision still wrong
A card labelled “versus last year” sounds unambiguous. It is not. The measure might compare ten current months with twelve prior months, a single selected month with an entire prior year, or ten days this October with all of October last year.
That mismatch can turn genuine growth into an apparent decline—or disguise a deteriorating trend. The fix is not a prettier visual. It is a declared period contract: what the default window means, what a month selection means, and what should happen when the current period is incomplete.
This tutorial uses a calendar-year model and a bar chart whose axis
is 'Date'[YearMonth]. With no single month selected,
the cards show the selected year through the current month and
compare the equivalent months one year earlier. When one bar is
selected, the cards show the full selected month and the same full
month last year.
Business rule before DAX: decide whether “current YTD” includes the open month. The main pattern below does. If trading data is incomplete during the month, use the closed-month variation in Step 5 or disclose that the open month is partial.
Write the expected behaviour before the measure
A small test matrix gives the report owner, analyst and approver the same definition of “comparable”.
| User context | Current period | Comparison period | Label |
|---|---|---|---|
| No month selected; current year is 2026 and current month is October | 1 Jan–31 Oct 2026 | 1 Jan–31 Oct 2025 | YTD Jan–Oct 2026 vs Jan–Oct 2025 |
| September 2026 selected | 1–30 Sep 2026 | 1–30 Sep 2025 | September 2026 vs September 2025 |
| Past year 2025 selected, no month selected | 1 Jan–31 Dec 2025 | 1 Jan–31 Dec 2024 | FY 2025 vs FY 2024 |
| October 2026 is open and the report uses closed periods | 1 Jan–30 Sep 2026 | 1 Jan–30 Sep 2025 | Closed YTD Jan–Sep 2026 vs Jan–Sep 2025 |
One governed calendar
Use one row per date, with unique contiguous dates and business-ready year and month attributes. Relate it to the fact table through the correct transaction date.
One detectable selection
Put YearMonth on the selecting visual. The measure can
then distinguish one month from the wider year context without
guessing from the chart title.
One matched window
Clear the incoming date filter, then deliberately apply the current and previous date boundaries. Other filters—region, product and customer—remain in context.
Build the comparison in six controlled steps
The examples assume a fact table called
FactSales with OrderDate and
SalesAmount. Rename those references to fit your model.
Give time intelligence a reliable spine
Create the table in Modelling → New table. Extend the start and end dates to cover the complete reporting horizon, not merely the rows loaded today.
Date =
VAR StartDate = DATE ( 2024, 1, 1 )
VAR EndDate   = DATE ( 2027, 12, 31 )
RETURN
ADDCOLUMNS (
    CALENDAR ( StartDate, EndDate ),
    "Year", YEAR ( [Date] ),
    "MonthNo", MONTH ( [Date] ),
    "Month", FORMAT ( [Date], "mmmm" ),
    "YearMonth", FORMAT ( [Date], "yyyy-MM" ),
    "YearMonthSort", YEAR ( [Date] ) * 100 + MONTH ( [Date] )
)
Sort Month by MonthNo and
YearMonth by YearMonthSort. Mark the
table as the model’s date table using Date[Date].
Create an active one-to-many relationship from
Date[Date] to FactSales[OrderDate].
Keep business aggregation separate from period logic
Sales =
SUM ( FactSales[SalesAmount] )
Use the same pattern for margin, orders or units by changing only the base measure. The period logic should not be duplicated inside every business metric.
Switch between one month and YTD
Sales — Current Comparison Period =
VAR IsSingleMonth =
    ISFILTERED ( 'Date'[YearMonth] )
        && HASONEVALUE ( 'Date'[YearMonth] )
VAR SelectedYear =
    SELECTEDVALUE ( 'Date'[Year], YEAR ( TODAY () ) )
VAR SelectedMonthNo =
    SELECTEDVALUE ( 'Date'[MonthNo] )
VAR PeriodEndMonth =
    IF (
        IsSingleMonth,
        SelectedMonthNo,
        IF ( SelectedYear = YEAR ( TODAY () ), MONTH ( TODAY () ), 12 )
    )
VAR PeriodStart =
    IF (
        IsSingleMonth,
        DATE ( SelectedYear, PeriodEndMonth, 1 ),
        DATE ( SelectedYear, 1, 1 )
    )
VAR PeriodEnd =
    EOMONTH ( DATE ( SelectedYear, PeriodEndMonth, 1 ), 0 )
RETURN
    CALCULATE (
        [Sales],
        REMOVEFILTERS ( 'Date' ),
        DATESBETWEEN ( 'Date'[Date], PeriodStart, PeriodEnd )
    )
HASONEVALUE confirms the context contains one
YearMonth; ISFILTERED prevents an
accidental one-month result from being treated as an intentional
selection. REMOVEFILTERS clears the incoming date
context before DATESBETWEEN applies the governed
window.
Make the prior period mirror the current period
Sales — Previous Comparable Period =
VAR IsSingleMonth =
    ISFILTERED ( 'Date'[YearMonth] )
        && HASONEVALUE ( 'Date'[YearMonth] )
VAR SelectedYear =
    SELECTEDVALUE ( 'Date'[Year], YEAR ( TODAY () ) )
VAR SelectedMonthNo =
    SELECTEDVALUE ( 'Date'[MonthNo] )
VAR PeriodEndMonth =
    IF (
        IsSingleMonth,
        SelectedMonthNo,
        IF ( SelectedYear = YEAR ( TODAY () ), MONTH ( TODAY () ), 12 )
    )
VAR PreviousStart =
    IF (
        IsSingleMonth,
        DATE ( SelectedYear - 1, PeriodEndMonth, 1 ),
        DATE ( SelectedYear - 1, 1, 1 )
    )
VAR PreviousEnd =
    EOMONTH ( DATE ( SelectedYear - 1, PeriodEndMonth, 1 ), 0 )
RETURN
    CALCULATE (
        [Sales],
        REMOVEFILTERS ( 'Date' ),
        DATESBETWEEN ( 'Date'[Date], PreviousStart, PreviousEnd )
    )
Because only filters on the Date table are removed, product,
customer, region and permitted row-level security filters
continue to shape both results. Do not use
REMOVEFILTERS() without a table argument here; that
would remove far more context than intended.
Expose both the number and its meaning
Sales — Comparison Change =
[Sales — Current Comparison Period]
    - [Sales — Previous Comparable Period]

Sales — Comparison Change % =
DIVIDE (
    [Sales — Comparison Change],
    [Sales — Previous Comparable Period]
)Sales — Comparison Label =
VAR IsSingleMonth =
ISFILTERED ( 'Date'[YearMonth] )
&& HASONEVALUE ( 'Date'[YearMonth] )
VAR SelectedYear =
SELECTEDVALUE ( 'Date'[Year], YEAR ( TODAY () ) )
VAR SelectedMonthNo =
SELECTEDVALUE ( 'Date'[MonthNo] )
VAR EndMonth =
IF (
IsSingleMonth,
SelectedMonthNo,
IF ( SelectedYear = YEAR ( TODAY () ), MONTH ( TODAY () ), 12 )
)
RETURN
IF (
IsSingleMonth,
FORMAT ( DATE ( SelectedYear, EndMonth, 1 ), "mmmm yyyy" )
& " vs "
& FORMAT (
DATE ( SelectedYear - 1, EndMonth, 1 ),
"mmmm yyyy"
),
IF ( SelectedYear = YEAR ( TODAY () ), "YTD ", "FY " )
& SelectedYear
& " vs "
& ( SelectedYear - 1 )
& " · through "
& FORMAT ( DATE ( SelectedYear, EndMonth, 1 ), "mmmm" )
)
Use this measure as the subtitle of the KPI group. If the current
open month should be excluded, replace
MONTH ( TODAY () ) in both comparison measures with
MONTH ( EOMONTH ( TODAY (), -1 ) ). At year
boundaries, also derive the year from that closed-month date so
December correctly belongs to the previous year.
Important: if the current month contains only ten days of actuals, comparing it with a complete prior-year month is not operationally fair. Use last closed month, compare month-to-date with the same day cut-off, or label the current result as partial. Choose one rule and document it.
Make the selection reach the cards
-
Use
Date[YearMonth]on the column chart axis and sort it byYearMonthSort. - Add the two period measures, change and percentage to cards or a KPI group.
- Add the label measure to a dynamic subtitle.
- Select the chart, open Format → Edit interactions, and ensure it filters the cards rather than highlighting or doing nothing.
- Test no month, one month, another year, a leap-year February and a month with no transactions.
Choose the comparison rule that matches the decision
There is no universally correct time window. There is a correct window for a stated business question.
| Question | Use | Avoid when | Control |
|---|---|---|---|
| How are we performing this financial year? | Closed-month YTD vs closed-month PYTD | Daily action depends on the latest trading | Display the close date |
| How did September perform? | Full selected month vs same month last year | September is still open | State “full month” or “partial” |
| How is today’s trading tracking? | Month-to-date vs same day cut-off last year | Trading calendars differ materially | Consider working-day alignment |
| Are we ahead of plan? | Actual vs budget using the same date window | Budget is only held monthly and actual is daily | Agree allocation or compare monthly |
A trusted comparison is an owned business rule
The report should make the period boundary visible, testable and change-controlled.
Business owner
Defines whether the open month is included, how restatements are treated and which decision the KPI supports.
Model owner
Maintains the Date table, relationships, measures, naming convention and regression tests after model changes.
Report owner
Controls interactions, titles, accessible labels and release notes so the displayed comparison matches the governed measure.
Four ways a sensible-looking chart becomes misleading
Month names without a year
Selecting “September” can include every September in the model.
Use a unique YearMonth key for filtering and display
a friendly label separately.
Cards ignore the bar selection
The DAX may be correct while visual interactions are disabled. Test the interaction icon and confirm the card context changes when one bar is selected.
Auto date hierarchies are mixed
A visual using an automatic hierarchy and a measure using the governed Date table may not share the expected context. Use fields from the explicit Date table consistently.
Partial periods masquerade as complete
A lower current result may simply reflect missing days. Show the data-through date and apply the same completeness rule to both periods.
Is your comparison ready for a management meeting?
Tick what is demonstrably true. The score updates locally in your browser; nothing is submitted.
Measure whether the change improves decisions
Fewer reconciliation queries
Track questions about date ranges and prior-year totals before and after release. A falling count suggests the comparison is easier to trust.
Faster meeting interpretation
Observe whether managers can state the two periods correctly without analyst explanation. Treat ambiguity as a design defect.
Lower measure duplication
Count bespoke current/prior calculations replaced by the governed pattern. Reuse reduces conflicting definitions and maintenance effort.
Power BI period comparison questions
Why not use SAMEPERIODLASTYEAR for everything?
SAMEPERIODLASTYEAR is useful when the current date
context already represents the exact intended window. This
tutorial constructs explicit boundaries because the business
rule switches between YTD and a full selected month, and because
the period end must be controlled.
What happens if users select more than one month?
The example falls back to the YTD or full-year rule because
HASONEVALUE is false. If multi-month comparison is
required, define it explicitly—for example, selected range versus
the same range last year—and build a separate tested branch.
How should a financial year be handled?
Replace the calendar-year start and end logic with the organisation’s governed fiscal calendar attributes. Do not merely subtract three months in every measure; put fiscal year, period and sort columns in the Date table and test the year boundary.
Does this pattern work with DirectQuery?
The measures can be used in DirectQuery models, but performance depends on the source, model and generated queries. Microsoft notes restrictions for some functions when used in DirectQuery calculated columns or row-level security rules; this tutorial uses them in measures. Test performance against the actual model.
Technical references
Product behaviour changes, so these implementation notes were checked against Microsoft Learn on 10 October 2026:
Turn “versus last year” into a controlled definition
Smart Statistics helps UK organisations design Power BI models and reports whose numbers, labels and interactions tell the same story—from the semantic model to the management meeting.