

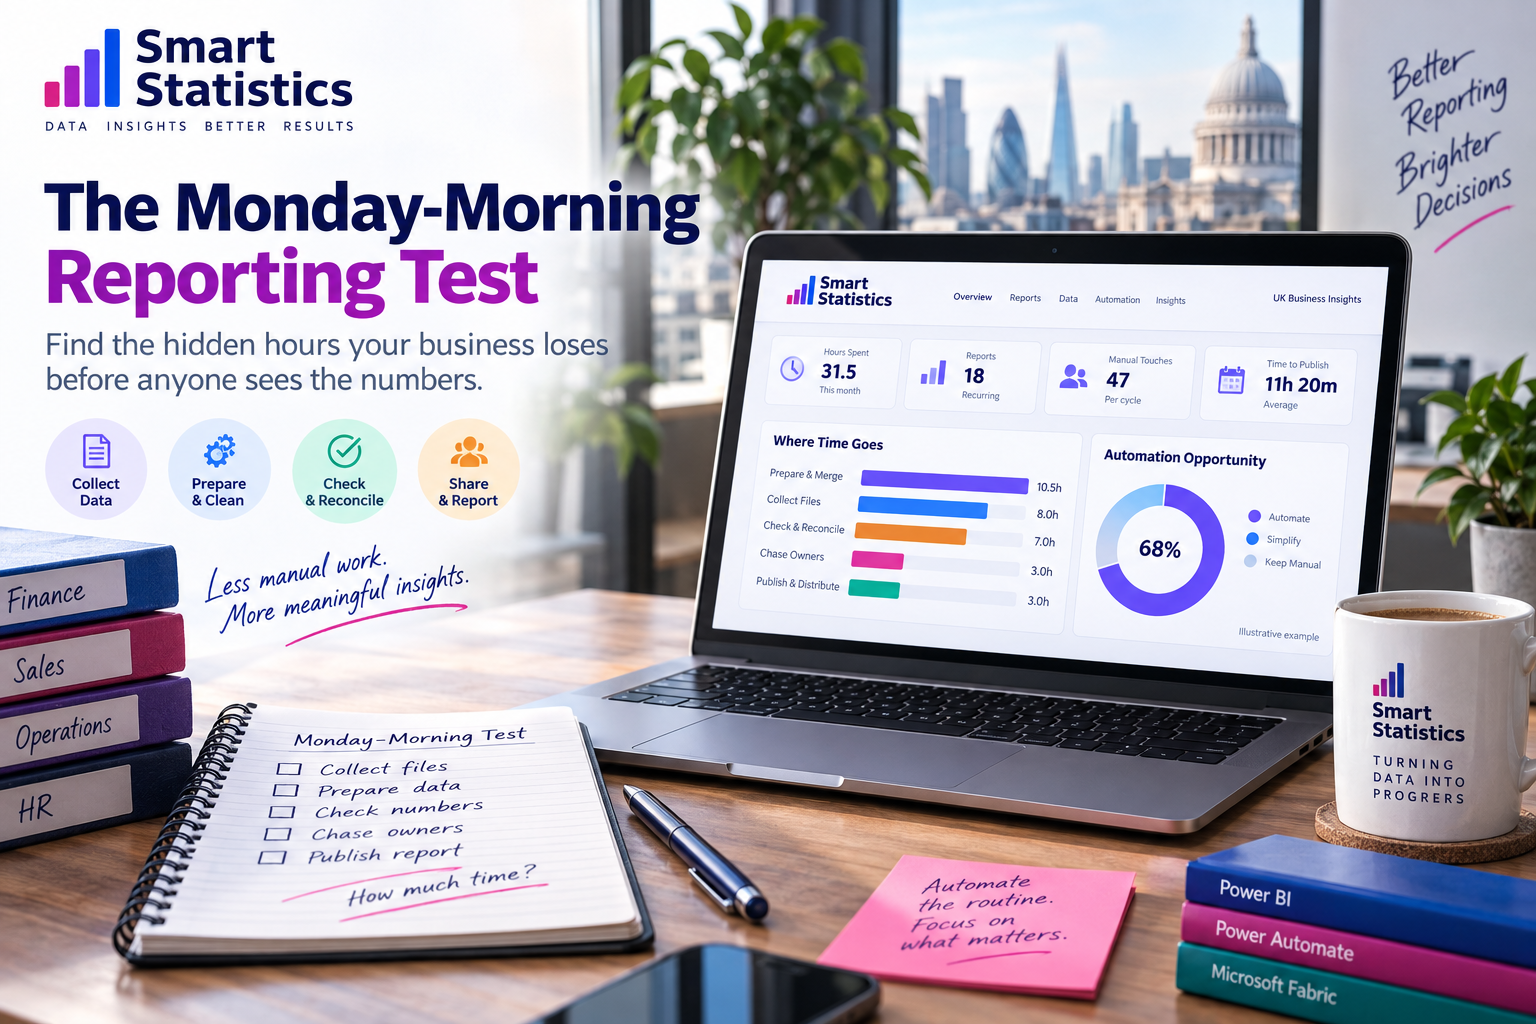
The Monday-Morning Reporting Test: Find the Hidden Hours Your Business Loses Before Anyone Sees the Numbers
Imagine arriving at work on Monday morning and following one management report from the moment somebody starts preparing it to the moment a decision-maker finally sees it.
How much of that journey is analysis — and how much is downloading files, copying data, fixing formats, chasing colleagues, reconciling totals, refreshing spreadsheets, checking versions and distributing attachments?
That difference matters. A business can appear highly data-driven while a surprising amount of skilled employee time is still being consumed simply manufacturing the report.
Where Reporting Time Goes
Delay Signals
The largest illustrative effort is not dashboard design. It is preparing, merging and validating the data before the report can be used.
Businesses Often Measure the Report. They Rarely Measure the Work Required to Produce It.
A management pack may take ten minutes to read but several hours to manufacture. The Monday-Morning Reporting Test exposes that production layer.
File Collection
Teams download CSV files, retrieve spreadsheets from shared folders, copy attachments from email and wait for colleagues to provide missing inputs.
Data Preparation
Columns are renamed, dates corrected, data appended, formulas copied, lookups repaired and old rows removed every reporting cycle.
Reconciliation
Analysts repeatedly compare totals with finance systems, operational records or last week's workbook because trust depends on manual checking.
Distribution
Finished reports are exported, renamed, emailed, uploaded and sometimes recreated for different audiences even when the underlying information is almost identical.
Follow One Report Through Five Types of Work
Do not begin by asking which technology should replace the report. Begin by understanding what people actually do to create it.
Collect
Where does the raw information come from and who must provide it?
Prepare
What cleansing, merging, formatting or calculations repeat every cycle?
Check
Which totals are reconciled and why are those checks required?
Chase
How much elapsed time comes from waiting for missing information or sign-off?
Deliver
How is the finished information published, distributed and explained?
Measure the Process Before Choosing the Technology
Inventory the Reports That Keep Coming Back
Start with recurring reporting rather than ad-hoc analysis. Weekly operational packs, monthly finance reports, client reports and executive dashboards are good candidates.
Record:
- Report name
- Business owner
- Producer
- Frequency
- Audience
- Primary decision supported
- Source systems
- Delivery deadline
ReportName
BusinessOwner
ReportProducer
Frequency
Audience
DecisionSupported
SourceSystems
DeliveryDeadline
Measure Human Effort, Not Just Elapsed Time
A report may take three days from start to finish while requiring only six hours of direct employee effort. Those are different problems.
Record both:
- Hands-on preparation time
- Waiting time
- Rework time
- Review time
- Distribution time
Reporting Friction Hours =
    Collection Time
  + Preparation Time
  + Validation Time
  + Rework Time
  + Chasing Time
  + Distribution Time
Separate Reporting Labour from Analytical Value
This is one of the most useful distinctions in the exercise. Time spent understanding the business is valuable. Time spent repeatedly copying the same data into the same template usually is not.
Classify each task as either:
Production Work
- Downloading
- Copying
- Cleaning
- Formatting
- Refreshing
- Exporting
- Distributing

Analytical Work
- Investigating variance
- Explaining change
- Challenging assumptions
- Identifying action
- Supporting decisions
Find the Controls Hidden Inside Manual Work
Not every manual step is waste. Some manual work exists because it provides an important control.
For example:
- A finance analyst reconciles totals before publication
- A manager approves unusual variances
- A team checks whether all sites submitted data
- A report owner investigates unexpected missing values
When automating, preserve the control even if you remove the manual mechanism.
Rank Improvements Before Building Anything
A useful automation candidate is usually repetitive, rules-based, frequent and sufficiently stable.
A simple prioritisation score can consider:
Automation Priority =
Frequency
× Manual Effort
× Error Exposure
× Business Importance
The formula above is a conceptual framework rather than a universal scoring model. Weight factors according to your own operating priorities.
How Much Time Could Recurring Reporting Be Consuming?
Adjust the illustrative inputs below to estimate the scale of recurring reporting effort. This is a diagnostic prompt, not an ROI calculation.
Reporting Inputs
Estimate the number of recurring reports, the average manual effort per report and how often the reporting cycle occurs.
Illustrative Reporting Effort
These outputs estimate preparation effort only. They do not represent a guaranteed saving or business case.
Reporting Automation Is Not One Technology
Once the friction is visible, select the technology according to the problem rather than forcing every report into the same platform.
Excel + Power Query
Useful when the main friction comes from repeatedly importing, cleaning, combining or reshaping structured files.
Power Automate
Useful for recurring file movement, notifications, approvals, data collection, reminders and process orchestration.
Power BI
Useful when repeated exporting and distribution can be replaced by a governed, interactive reporting experience.
SQL / Microsoft Fabric
Useful when the underlying problem is fragmented data, repeated extracts, scale or the need for a more reusable analytical data layer.
Reporting Process Audit FAQs
What is a reporting process audit?
Should every manual report be automated?
Which reports should we review first?
Is Power BI always the answer?
How do we calculate the value of automation?
What if manual checks are important controls?
Can this approach be used outside finance?
How can Smart Statistics help?
Before You Build Another Dashboard, Find Out How Much Work Happens Before the Dashboard Is Ready.
The biggest reporting opportunity may not be another chart. It may be removing the repeated downloads, spreadsheet merges, reconciliations, email chases and manual distribution that happen every reporting cycle.
Smart Statistics helps UK businesses redesign the entire reporting process — from source data and automation through to governed analytics and decision-ready reporting.