

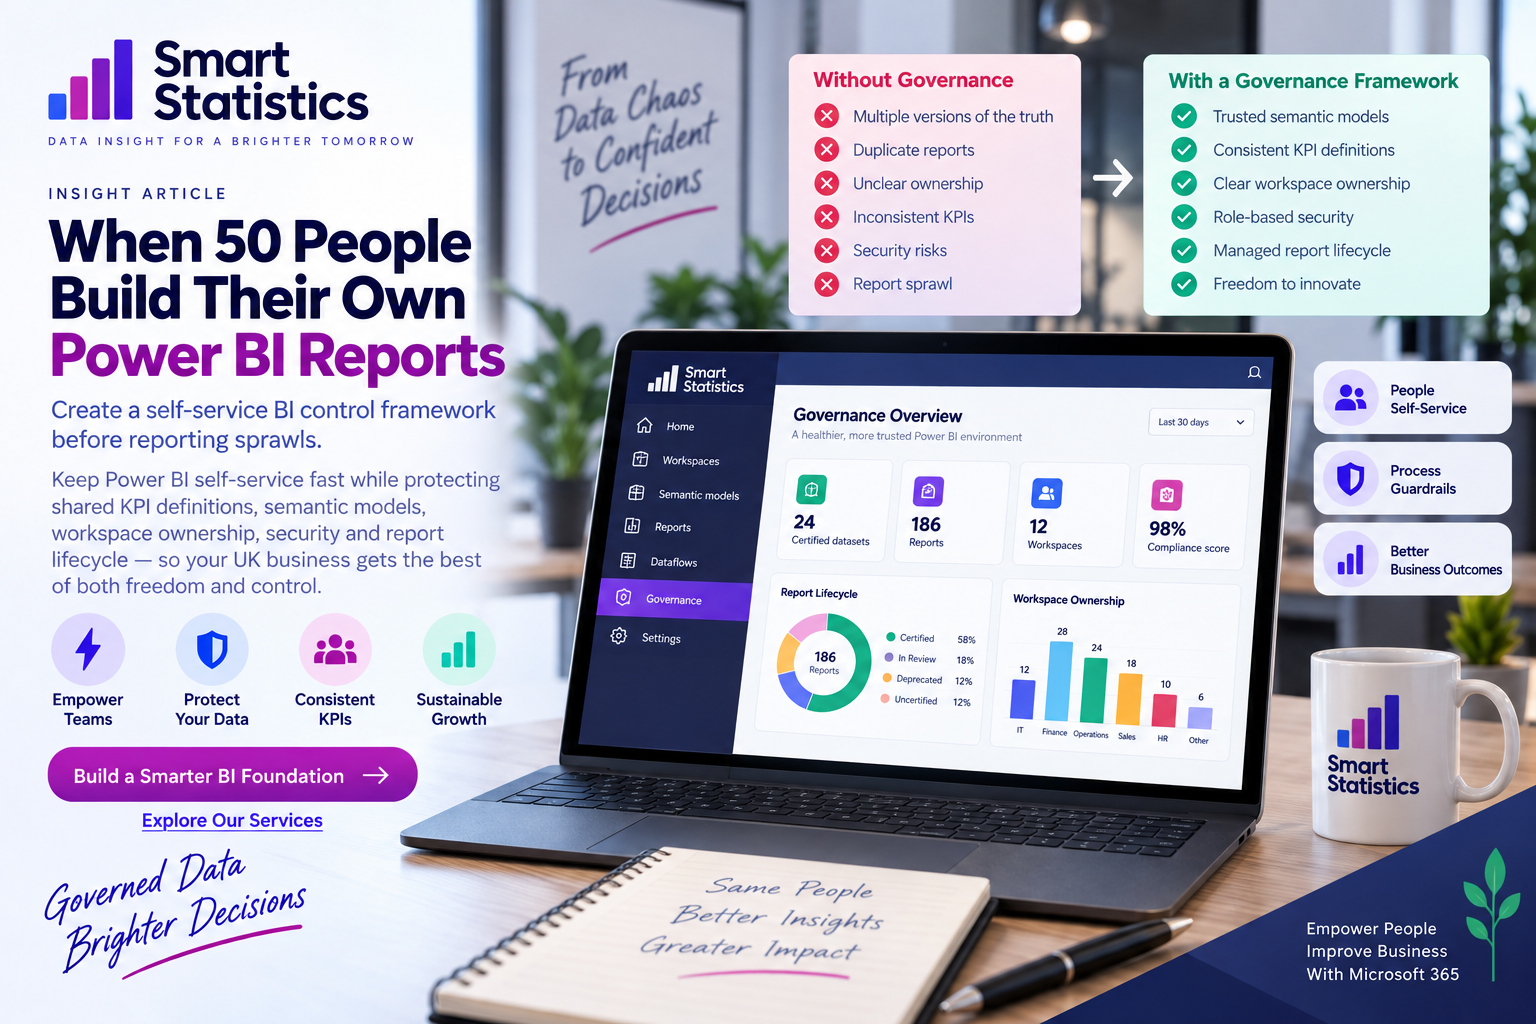
When 50 People Build Their Own Power BI Reports
Self-service analytics often starts exactly as intended: finance builds something useful, operations creates a dashboard for its team, sales develops another model and managers finally stop waiting for every question to reach the central reporting team.
Then the estate grows.
Revenue is defined differently in three models. Nobody is sure who owns a popular report. Old workspaces remain live. Users export data from one report to reconcile another. Management asks a simple question: Which number should we trust?
The answer is not to stop self-service reporting. It is to introduce enough control that people can move quickly without creating a second reporting problem.
Before: Report Sprawl
After: Governed Self-Service
Self-service remains available, but production reporting now uses agreed models, named ownership and an explicit lifecycle.
The Thing That Makes Power BI Powerful Can Also Create Reporting Sprawl
Giving more people the ability to analyse data reduces the bottleneck around a central BI team. Without clear guardrails, however, decentralised development can create duplicated logic, fragmented ownership and competing versions of the truth.
KPI Drift
Revenue, margin, active customer or headcount can quietly acquire different definitions as teams build independent semantic models.
Ownerless Reports
A report can remain business-critical long after the person who created it changes role, leaves the organisation or stops maintaining it.
Workspace Sprawl
Development, testing, departmental analysis and production content can become mixed together until nobody knows what is safe to rely on.
Access Confusion
Users may gain access directly to workspaces, apps, reports and underlying data without a consistent audience model.
Do Not Govern Power BI by Stopping People Building
The objective is not central control over every chart. Governance should distinguish experimentation from content the wider business is expected to trust.
What Heavy-Handed Governance Gets Wrong
If every new report requires a lengthy approval process, users will return to unmanaged spreadsheets, local extracts and offline reporting.
The Better Model: Govern the Trust Boundary
Let teams experiment, prototype and answer local questions. Apply stronger controls when content becomes shared, business-critical or part of formal management reporting.
Five Controls That Keep Self-Service Sustainable
The framework does not need to begin with a large governance programme. Start with the controls that answer five practical questions about your reporting estate.
Inventory
What reports, semantic models and workspaces exist?
Ownership
Who is accountable for each production asset?
Certification
Which models should users treat as authoritative?
Access
Who develops, publishes and consumes each type of content?
Lifecycle
When should content be reviewed, improved or retired?
Build the Governance Layer Without Rebuilding Everything
Create an Inventory of What Already Exists
You cannot govern an estate you cannot see.
Start by creating a structured inventory covering the Power BI content that matters to the organisation.
- Workspace name
- Report name
- Report ID
- Semantic model
- Business area
- Primary owner
- Backup owner
- Audience
- Production status
- Last reviewed date
Workspace
ReportName
ReportId
SemanticModelId
BusinessArea
OwnerEmail
BackupOwnerEmail
LifecycleStatus
IsCertified
LastReviewDate
Classify Content by Business Importance
A personal exploratory report should not require the same controls as a board-level management pack.
A simple classification might be:
Personal / Exploratory
Team / Departmental
Shared Operational
Business Critical
Executive / Regulatory
As the audience and business impact increase, strengthen:
- Ownership requirements
- Testing expectations
- Change control
- Security review
- Documentation
- Refresh monitoring
Reduce Duplicate Semantic Models Before Duplicate Reports
Ten reports using one governed model can be easier to control than three reports that each define the same business logic differently.
Look for repeated modelling patterns such as:
- The same finance ledger imported multiple times
- The same customer dimensions rebuilt by different teams
- Repeated date tables
- Revenue measures with different filters
- Different definitions of active customers
Move repeatable business logic into reusable semantic models where that improves consistency.
Make Ownership a Property of the Report
“The finance team owns it” is often not enough. Production content should have identifiable accountability.
Record:
- Business owner
- Technical owner
- Backup owner
- Review frequency
- Business purpose
An ownership exception measure in a governance dashboard could be:
Orphaned Reports =
CALCULATE(
    DISTINCTCOUNT(
        ReportInventory[ReportId]
    ),
    FILTER(
        ReportInventory,
        ISBLANK(
            ReportInventory[OwnerEmail]
        )
    )
)
Separate Development from Business Consumption
Avoid treating every workspace as both a development area and the final distribution mechanism.
Establish a recognisable workspace pattern appropriate to your organisation, for example:
Finance - Development
Finance - Test
Finance - Production

Operations - Development
Operations - Production
Then define who may:
- Create models
- Edit production content
- Publish apps
- Share reports
- Access underlying data
Define What “Trusted” Means Before Certifying Content
Certification should represent a real organisational standard rather than becoming another label everybody can apply.
Your internal certification checklist might confirm:
- Business owner exists
- Metric definitions are documented
- Security has been reviewed
- Refresh behaviour is understood
- Source systems are approved
- Key measures have been reconciled
- Support ownership is clear
An illustrative coverage measure:
Certified Model Coverage % =
DIVIDE(
    CALCULATE(
        DISTINCTCOUNT(
            ReportInventory[SemanticModelId]
        ),
        ReportInventory[IsCertified] = TRUE()
    ),
    DISTINCTCOUNT(
        ReportInventory[SemanticModelId]
    )
)
Give Reports an End-of-Life Process
Most BI estates accumulate content because creating a new report is easier than retiring an old one.
Review production content periodically for:
- Low or declining usage
- Duplicate purpose
- Expired business processes
- Inactive owners
- Old data sources
- Replacement reports
Use lifecycle states such as:
Development
Pilot
Production
Under Review
Deprecated
Retired
How Controlled Is Your Power BI Estate?
Select the controls that already exist in your environment. The result is an illustrative diagnostic intended to prompt discussion rather than provide a formal maturity assessment.
Existing Controls
Tick each control that is consistently applied across the Power BI content your business relies on.
Illustrative Governance Score
This score is based only on the controls selected on this page.
Select the controls that are already operating consistently in your Power BI environment.
Governance Works Better When Everybody Knows Their Role
Self-service does not mean everybody owns every part of the reporting stack.
BI / Data Team
Establish platform standards, trusted models, security patterns, governance controls and reusable analytical assets.
Business Report Builders
Explore data, create local analysis and build reports using shared semantic models where appropriate.
Business Owners
Approve business definitions, determine whether reports remain relevant and own the decisions supported by the content.
Power BI Governance FAQs
What is self-service BI governance?
Does governance mean centralising every report?
Should every Power BI report use the same semantic model?
What should be certified in Power BI?
How do we deal with hundreds of existing reports?
Should unused reports be deleted immediately?
Can Microsoft Fabric be included in the same governance model?
How can Smart Statistics help?
Power BI Does Not Become Difficult Because You Have Too Many Charts. It Becomes Difficult When Nobody Knows Which Ones to Trust.
Self-service analytics should make the business faster, not create dozens of competing definitions of the same metric.
Smart Statistics helps UK businesses build reporting estates where teams can explore and innovate while trusted semantic models, clear ownership, security and lifecycle controls protect the information used for important decisions.